
Help
Frequently Asked Questions (FAQ)
The MyResearcher support team is available to help you with any problems you may have. We can be reached via email at support@myresearcher.com. You can also contact us directly at (702) 818-8881. Should you need to reach us via mail, our address is:
MyResearcher.com
6385 South Rainbow Boulevard, Suite #105
Las Vegas, Nevada 89118
Joining MyResearcher is easy. You will need your name, an email address, and a valid credit card to complete the process. Below are the steps.
From the home page (www.myresearcher.com), select the “Create a New Account” button.

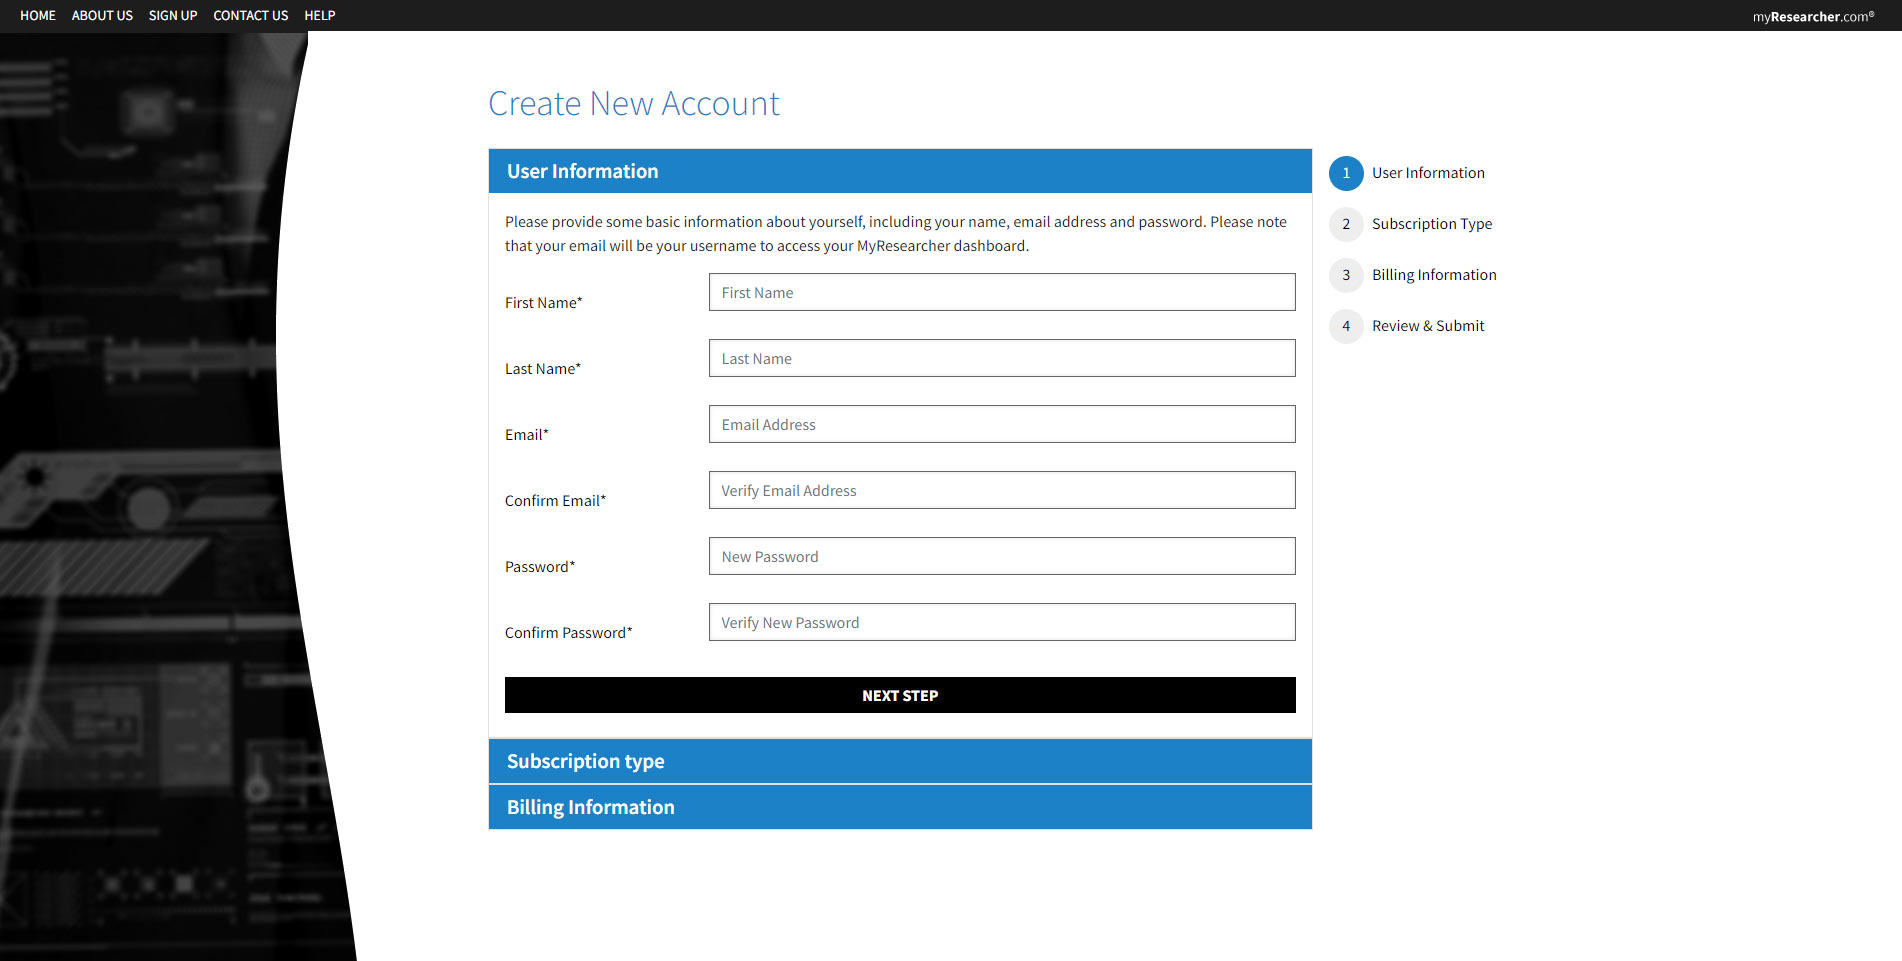
This will take you to the Account Creation page where you will be asked for your name, email address and to create a password. When you have completed this process, the “Select Subscription” button will prompt you to continue to Step #2.
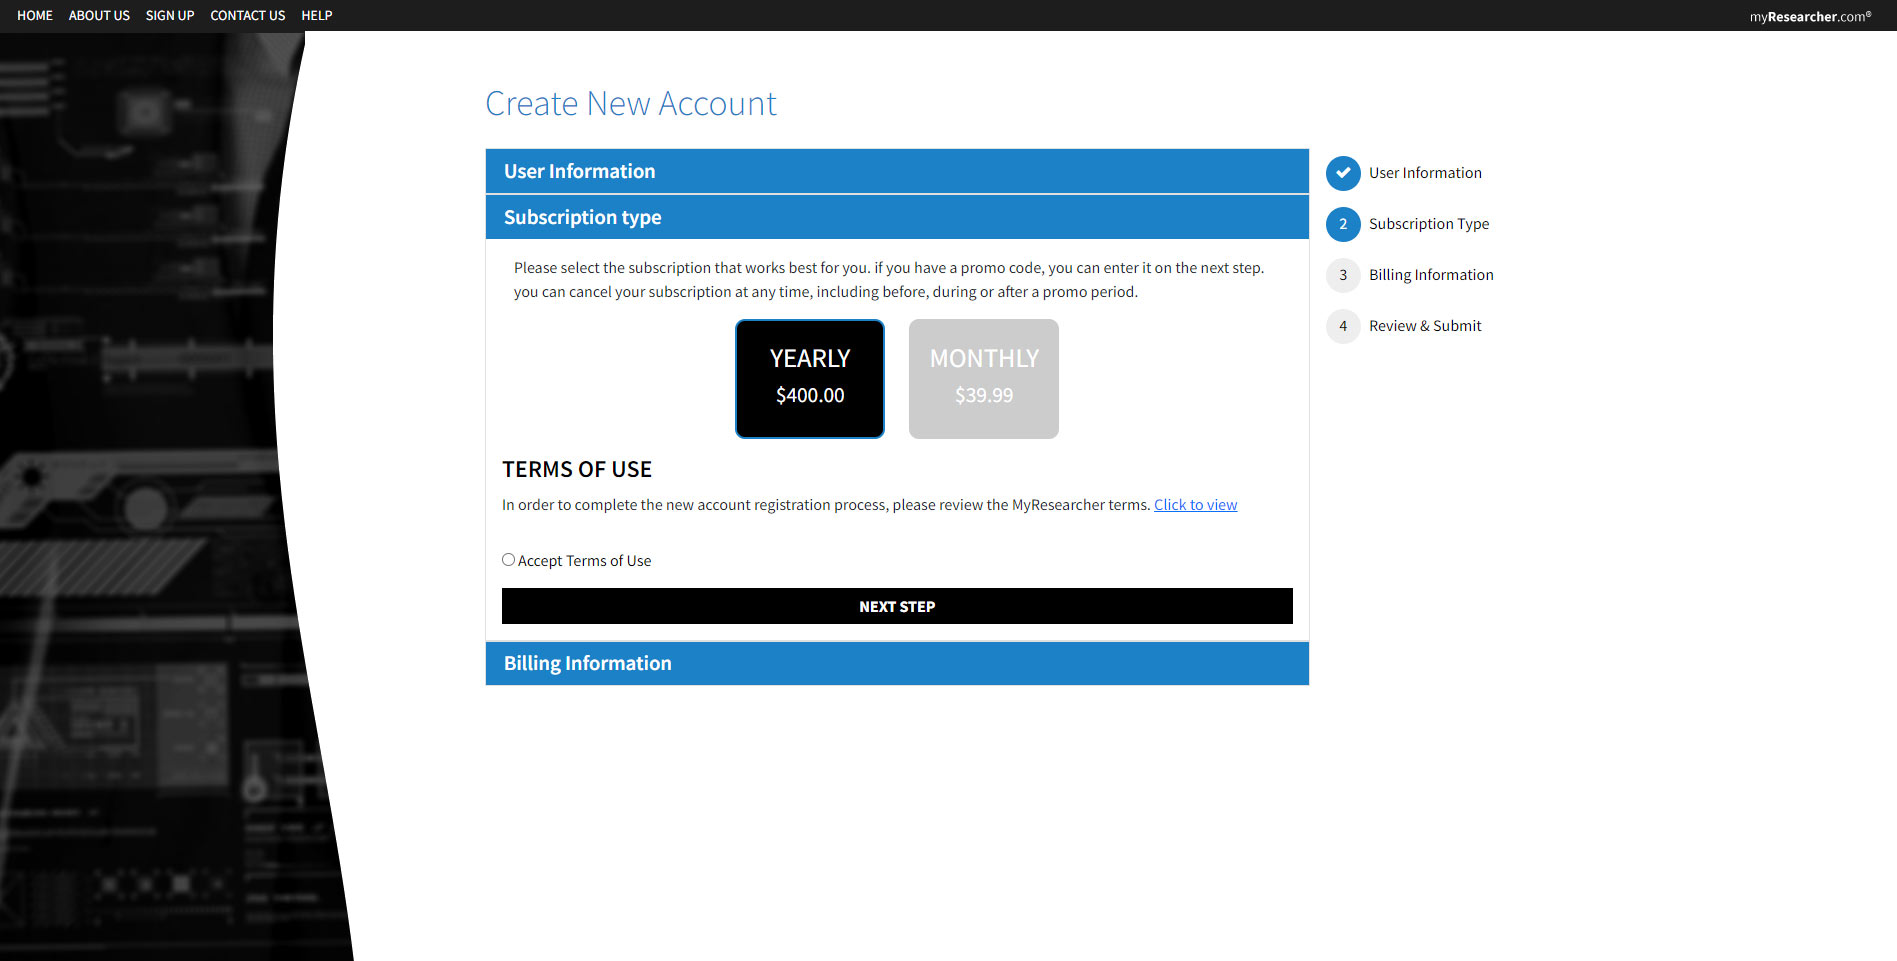
In Step #2, you will need to choose a subscription type. There are currently two options: (1) a month-to-month subscription charged at $39.99 per month, or (2) an annual subscription charged at $400 for a full year (365 days). Once you select a subscription, you will be prompted to continue to Step #3, Billing Information. MyResearcher does offer corporate site license subscription options. To learn more about these please contact us at info@myresearcher.com or (702) 818-8881.
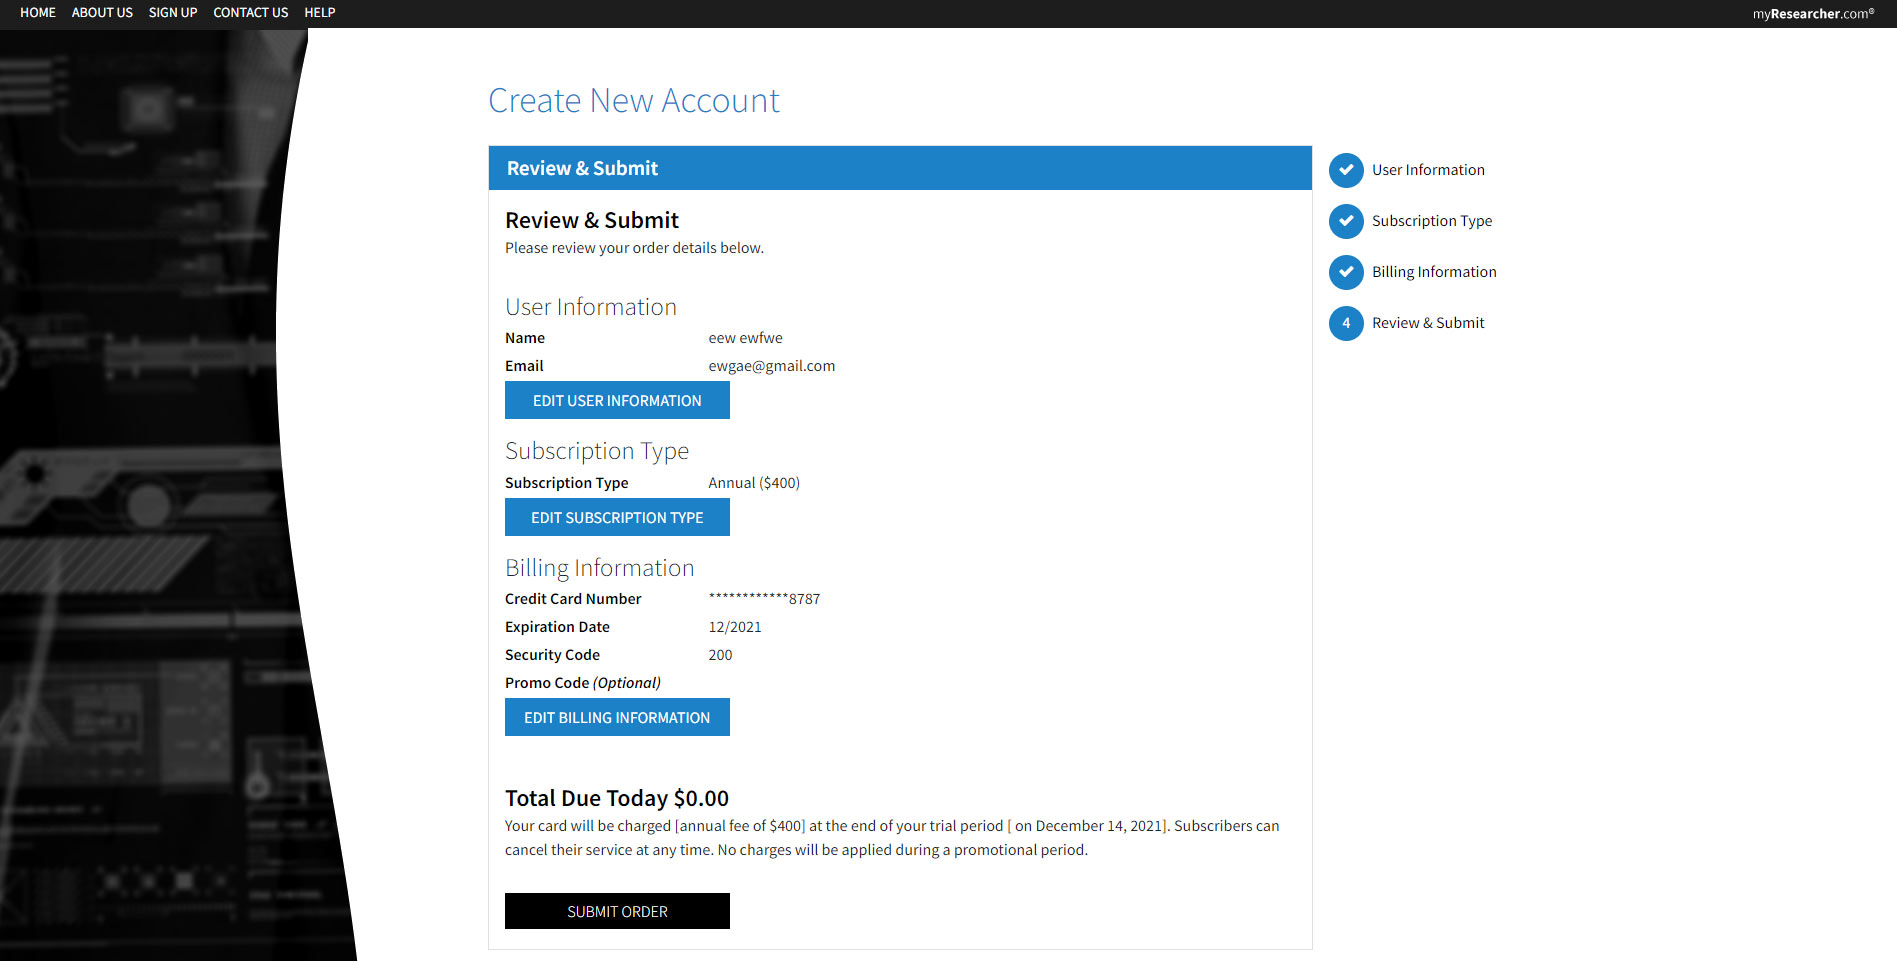
In Step #3, you will be asked to provide your credit card information. Once this is completed, you will be prompted to continue to Step #4, Confirmation.

The final step is the confirmation. Please review the terms of use. If you choose to accept them, your registration process is complete.
Once you are registered, you can gain access to MyResearcher by logging in on the MyResearcher home page (www.myreseacher.com).

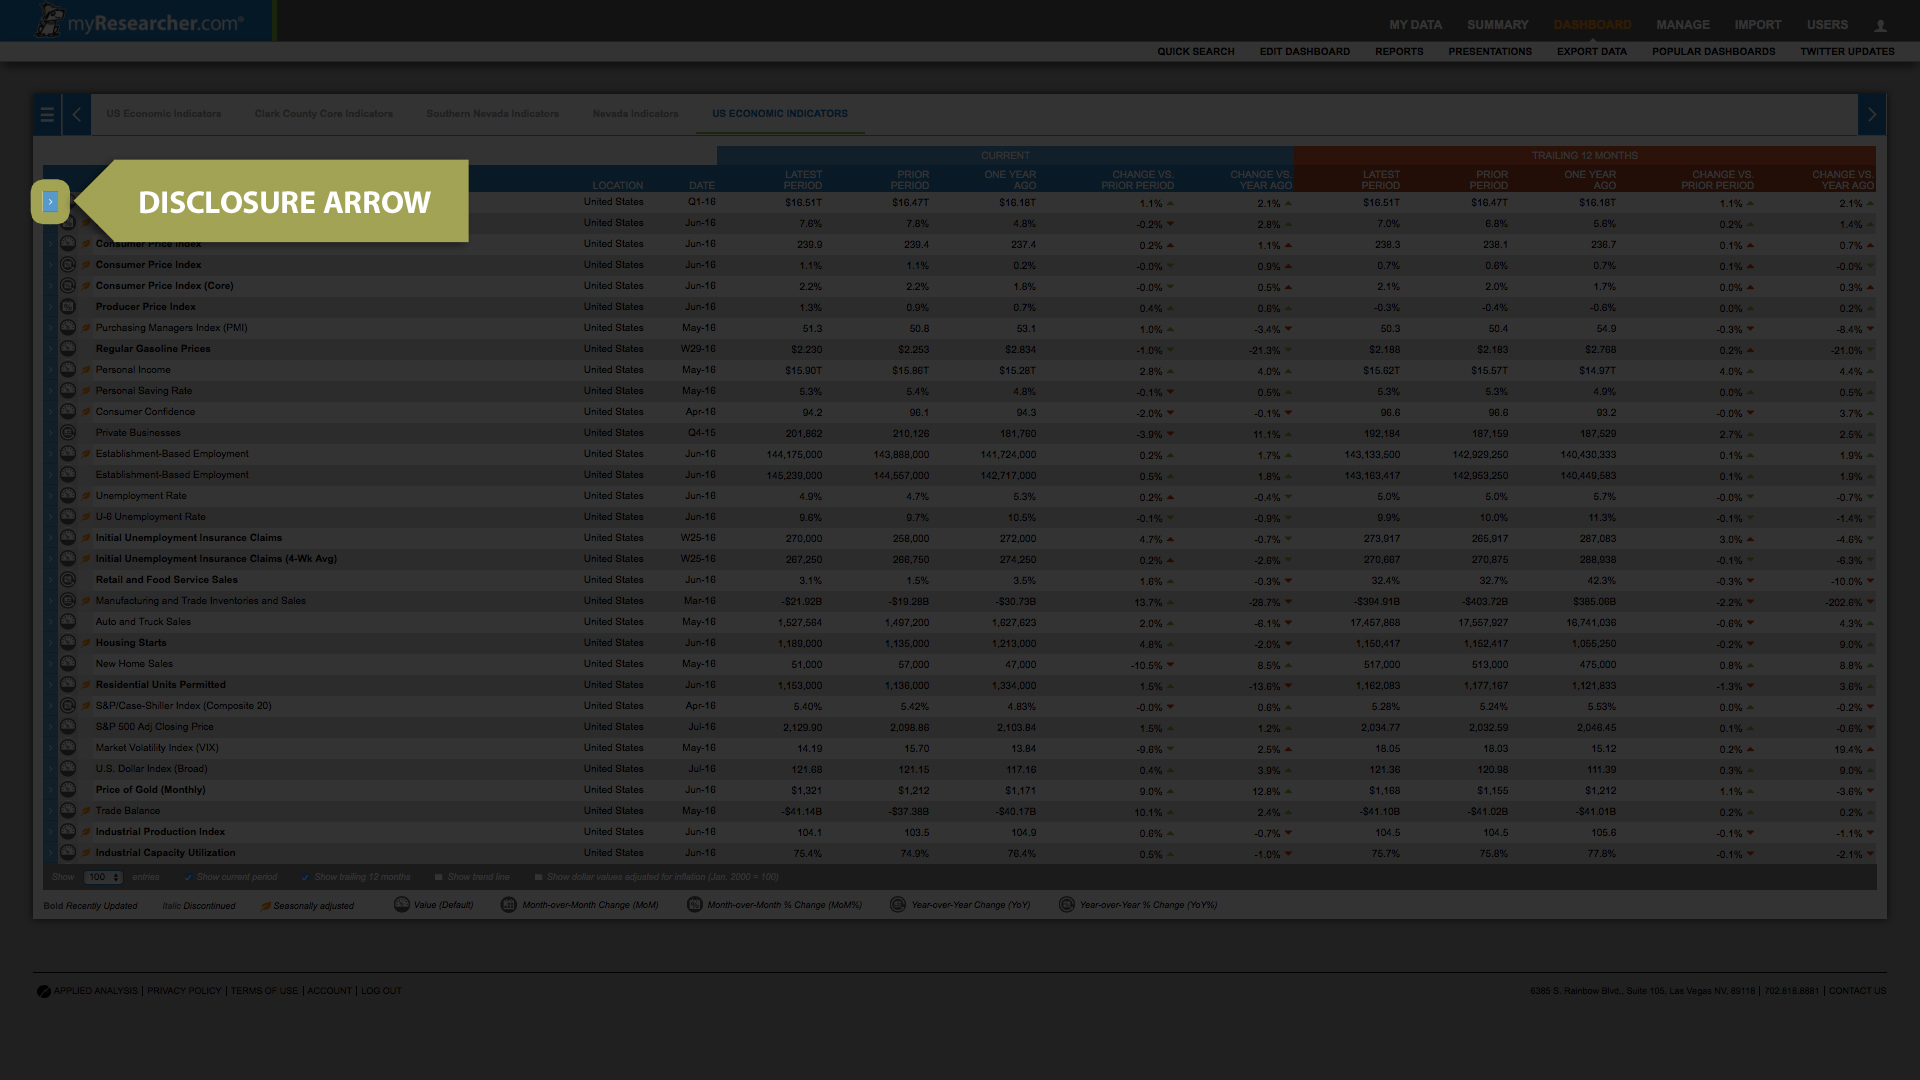
From your Dashboard click on the arrow next to the indicator you would like to learn more about. This will reveal a number of options.
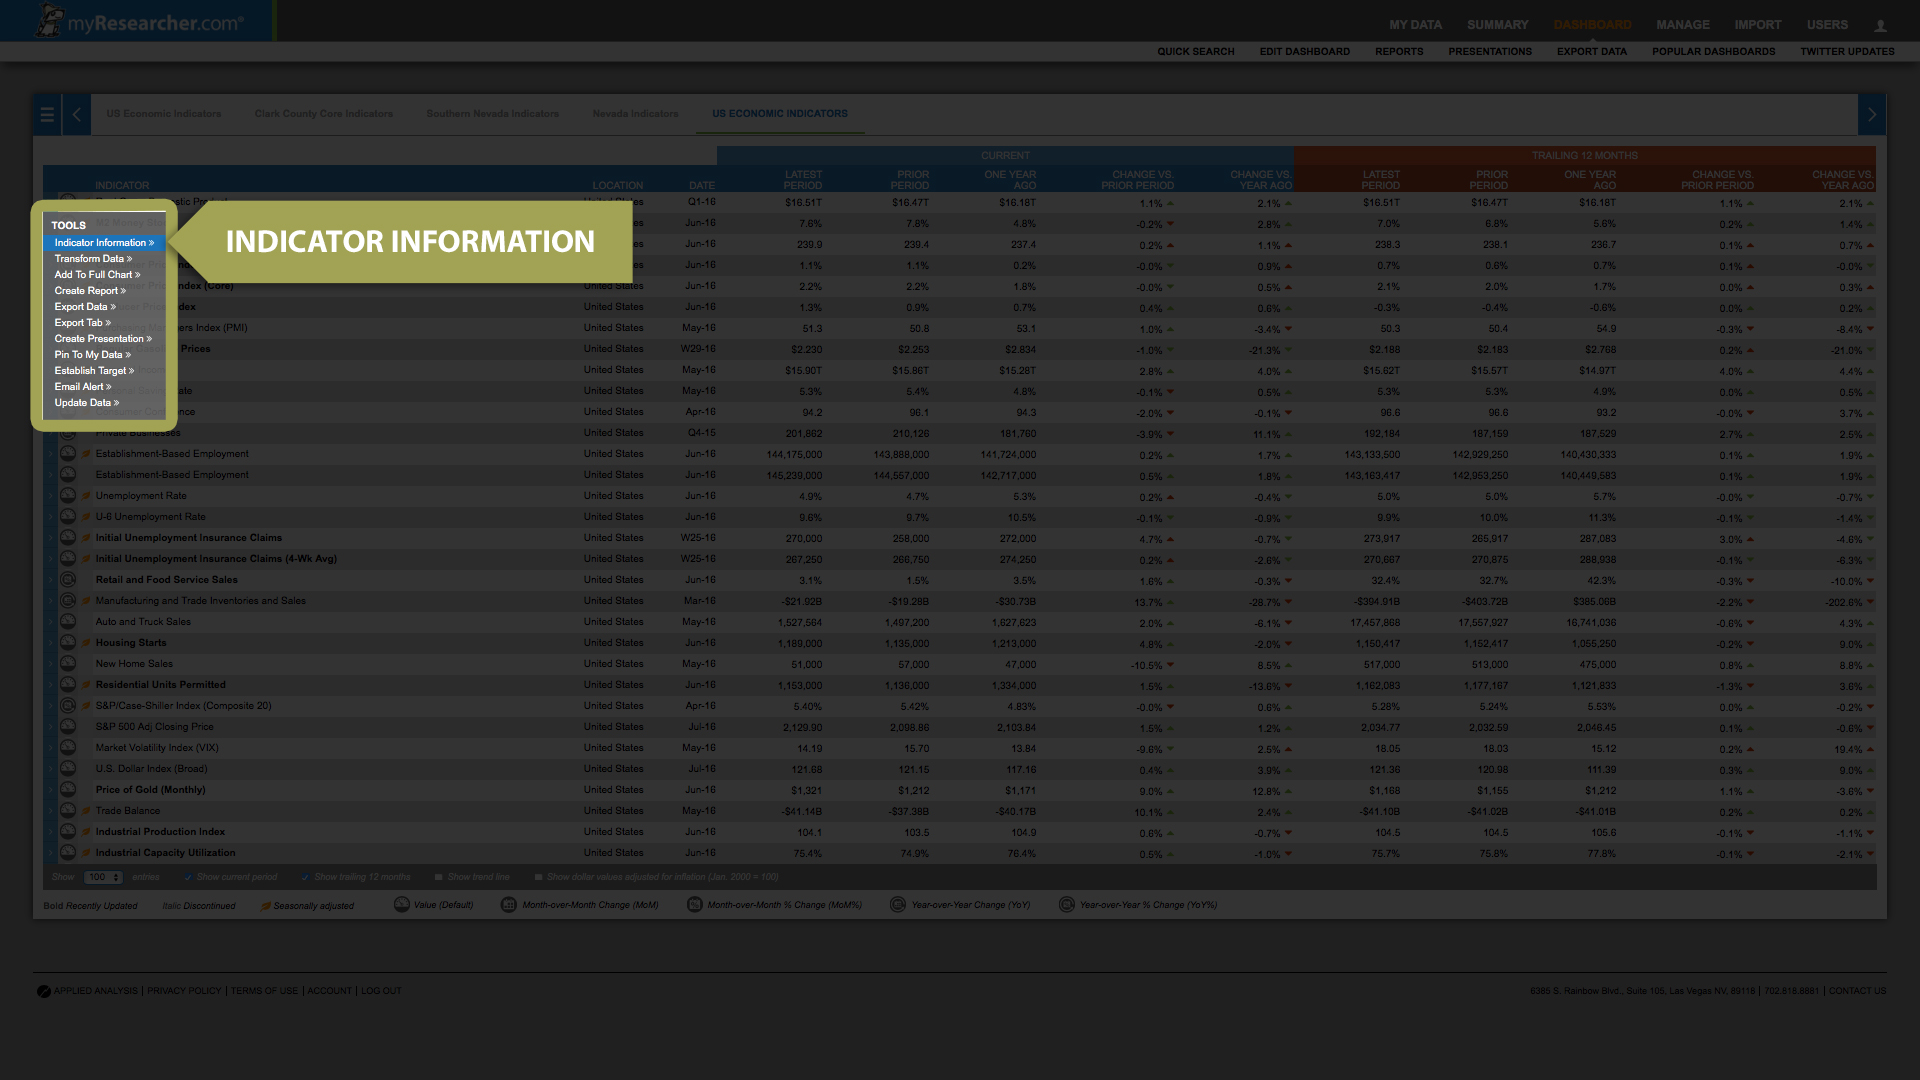
Select “Indicator Information”
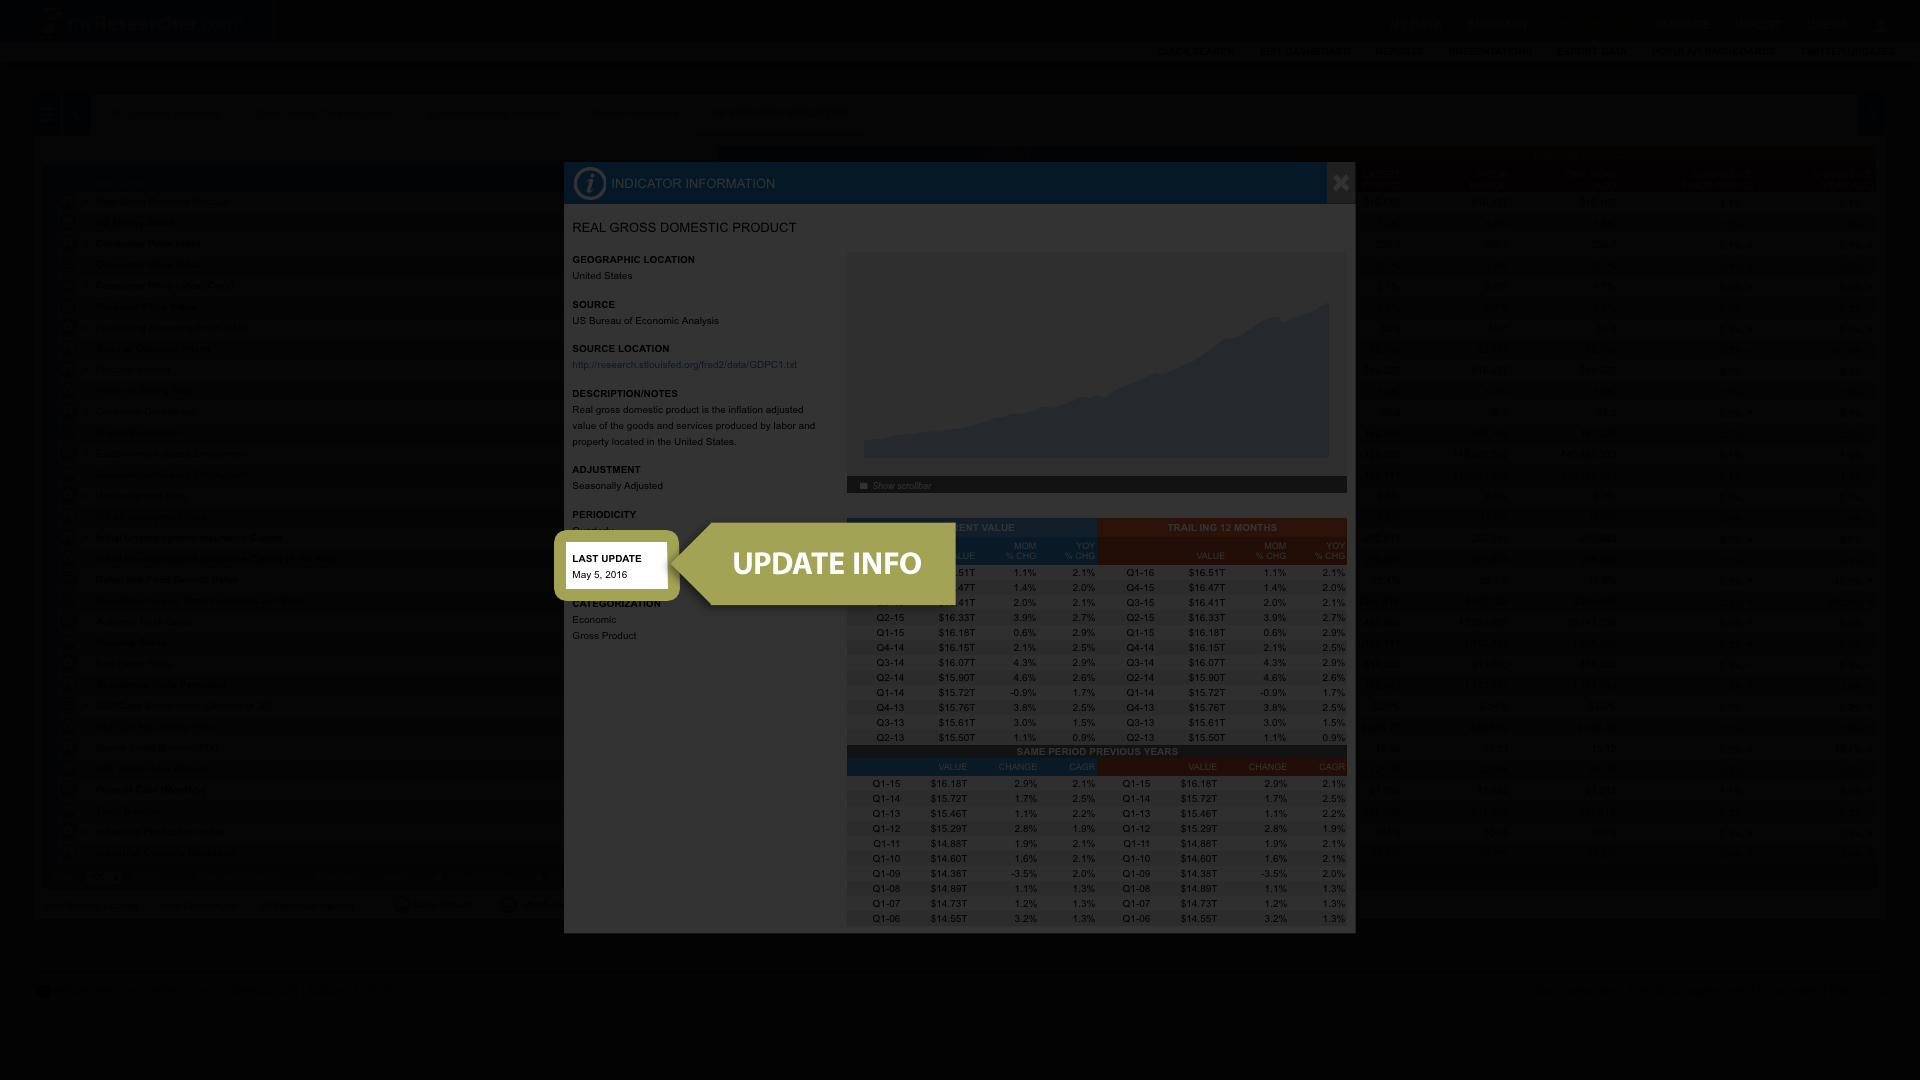
This will reveal additional information about the selected indicator including information about the last update.
From your Dashboard click on the arrow next to the indicator you would like to learn more about. This will reveal a number of options.
Select “Indicator Information”
This will reveal additional information about the selected indicator including source name and location.
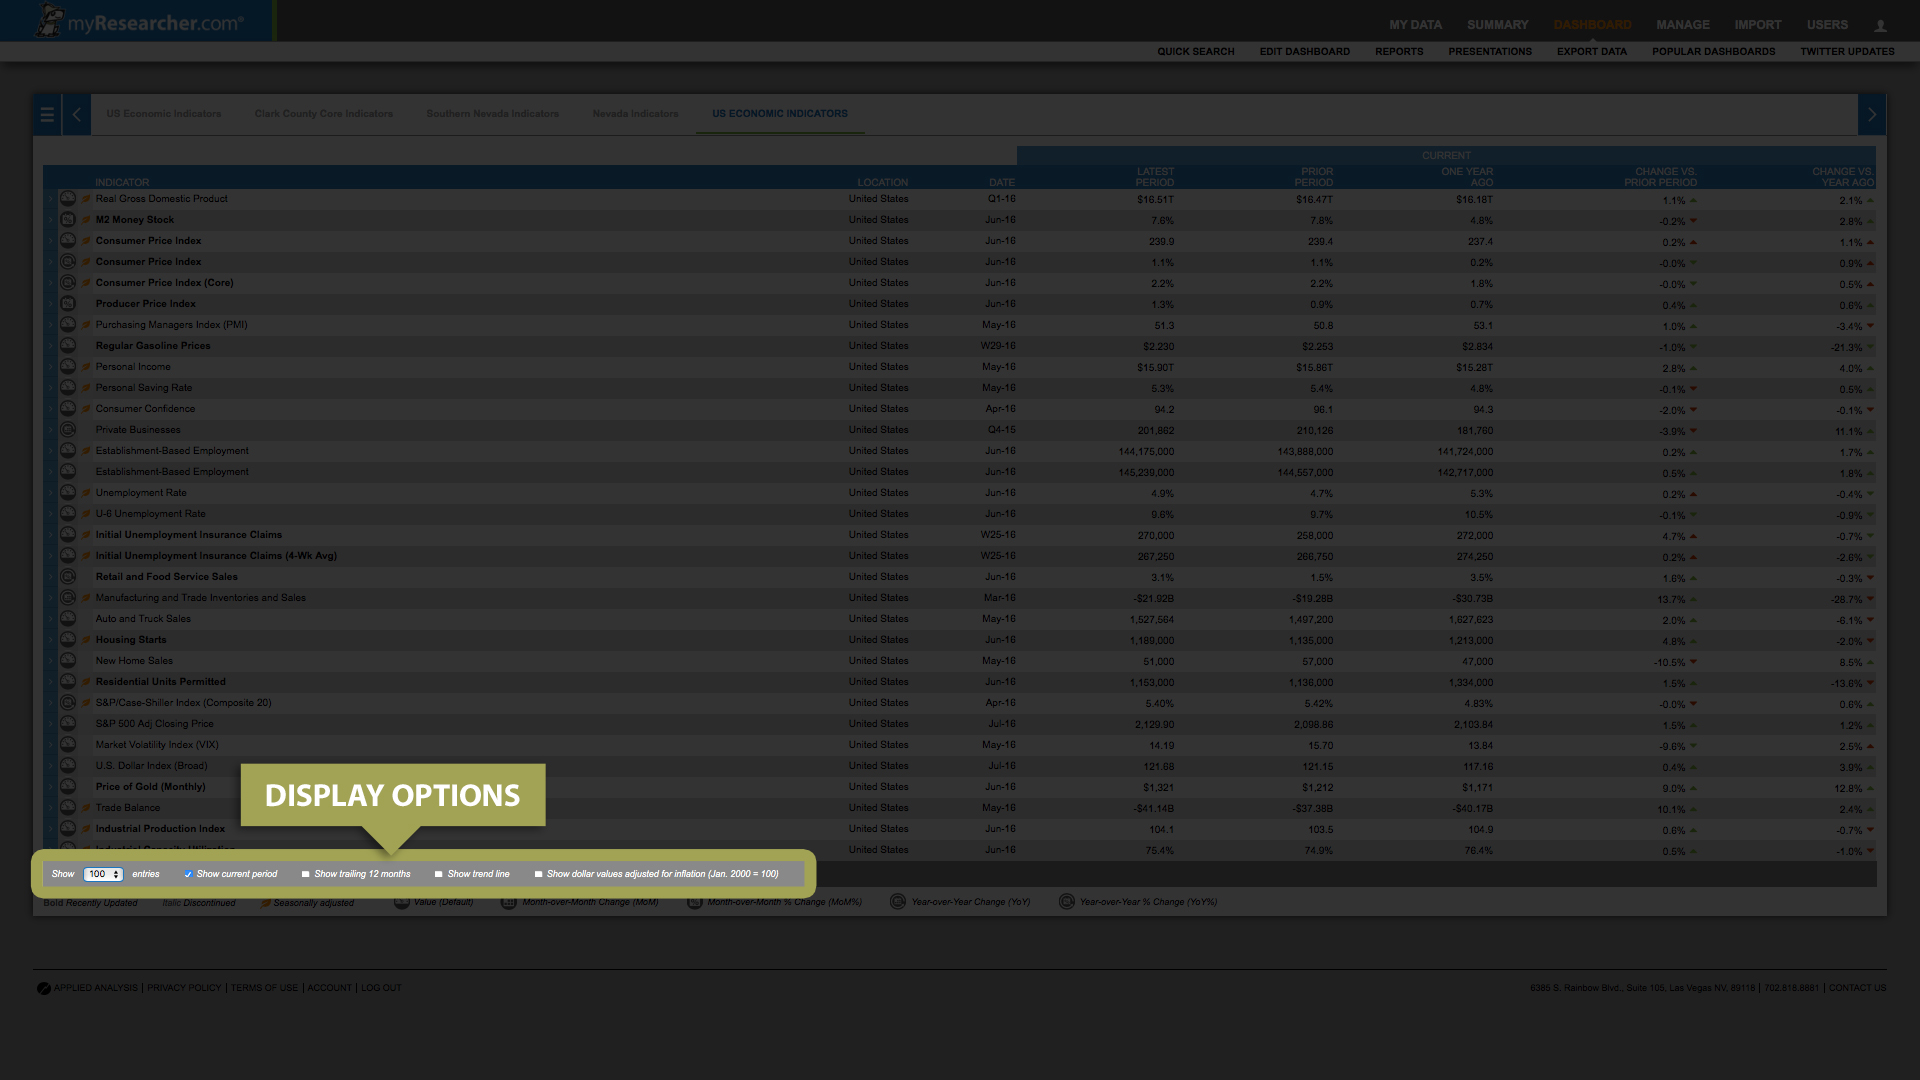
Using the controls at the bottom of the tab's data table, users can choose to view Current Period Data, Trailing 12 Months and/or a Trendline
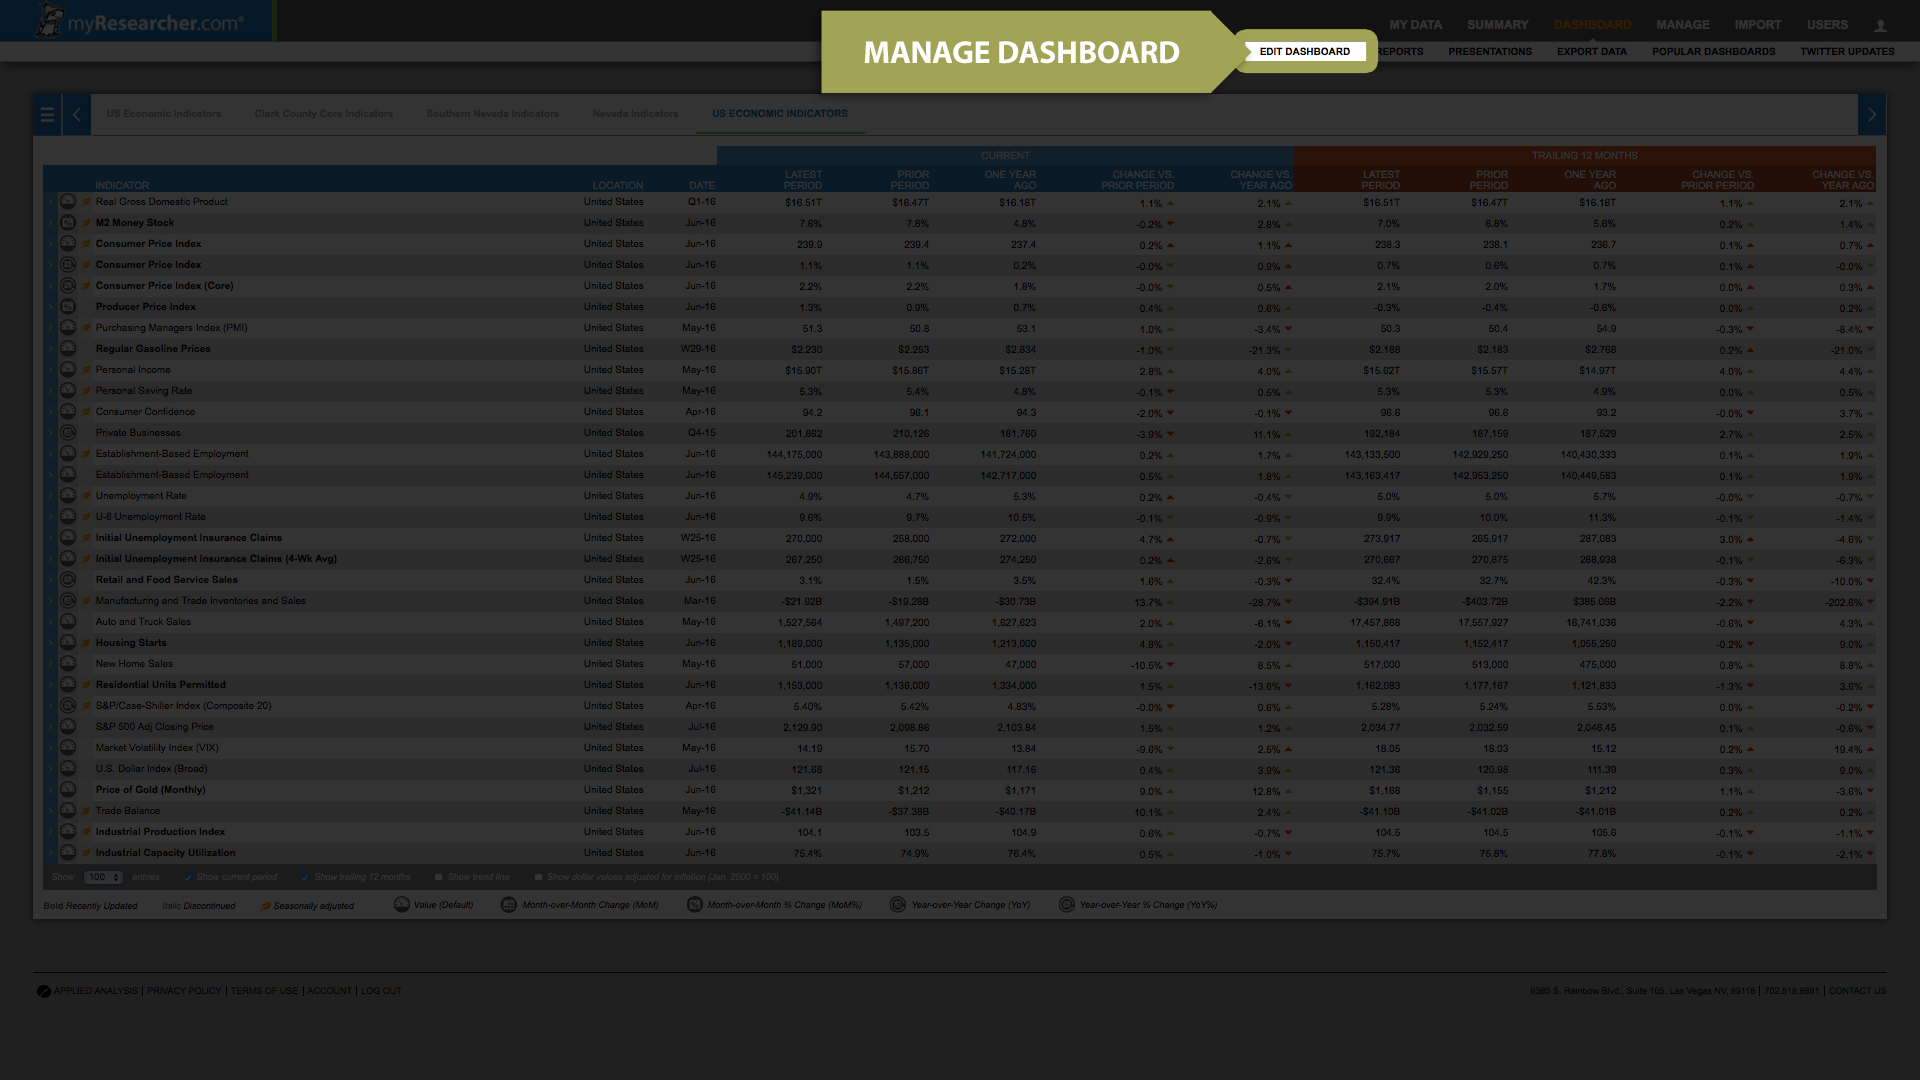
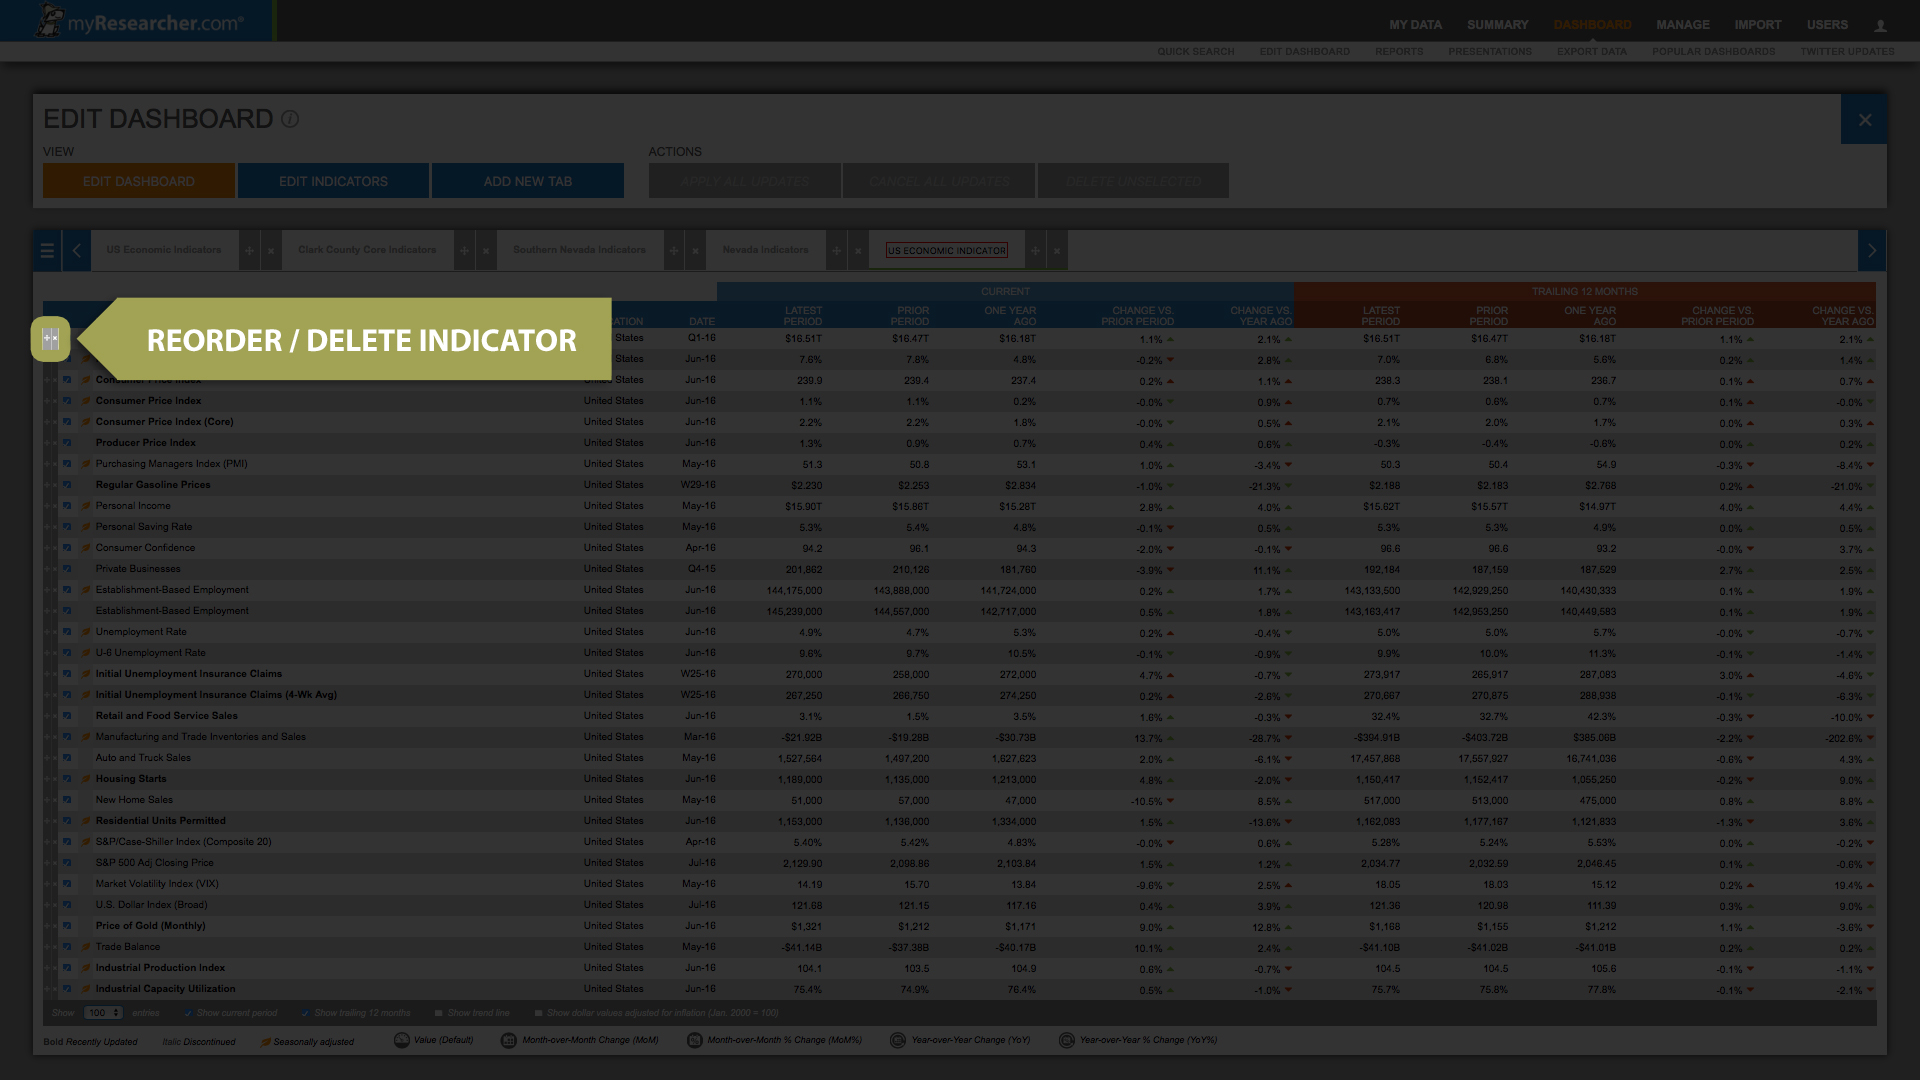
From the “Dashboard” menu at the top of the page, click on the “Edit Dashboard” button in the submenu. This will open the Dashboard Editor.
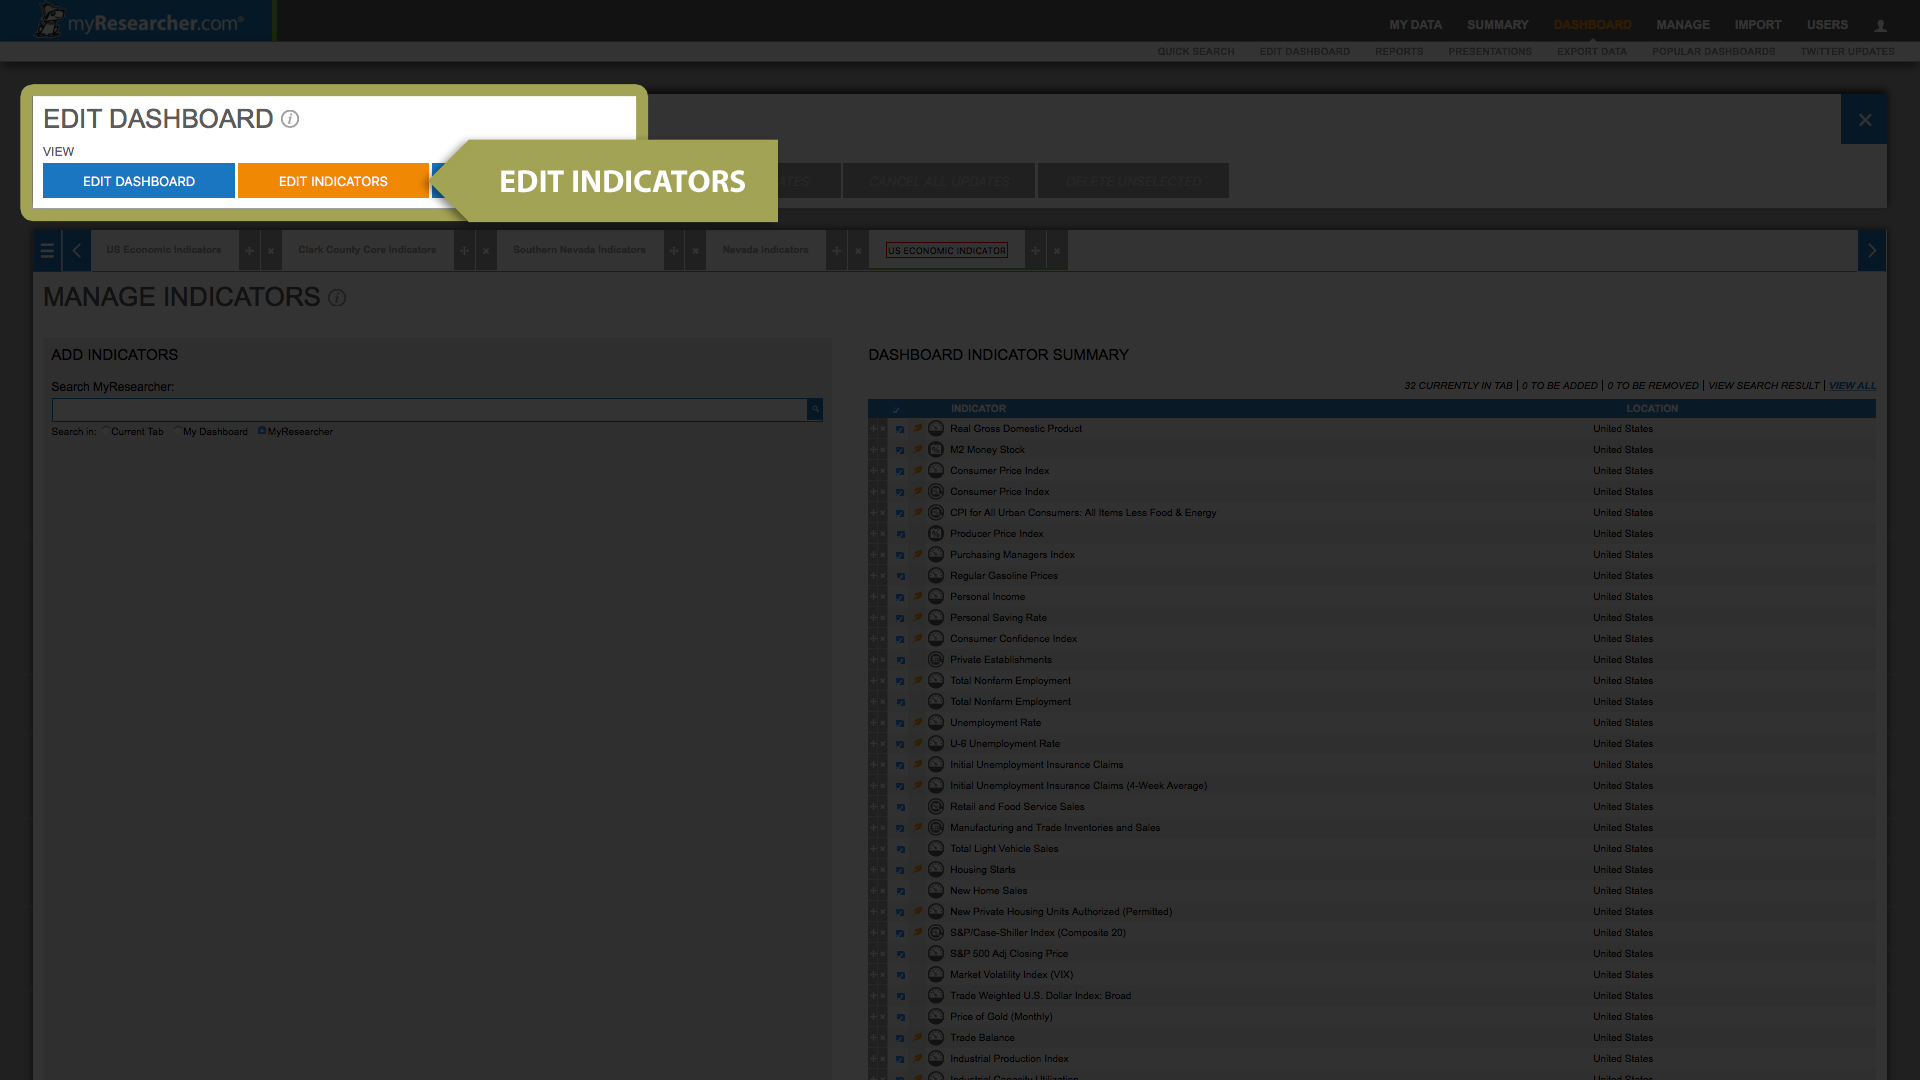
From the Dashboard Editor, click on the “Edit Indicators” button.
From the “Dashboard” menu at the top of the page, click on the “Edit Dashboard” button in the submenu. This will open the Dashboard Editor.

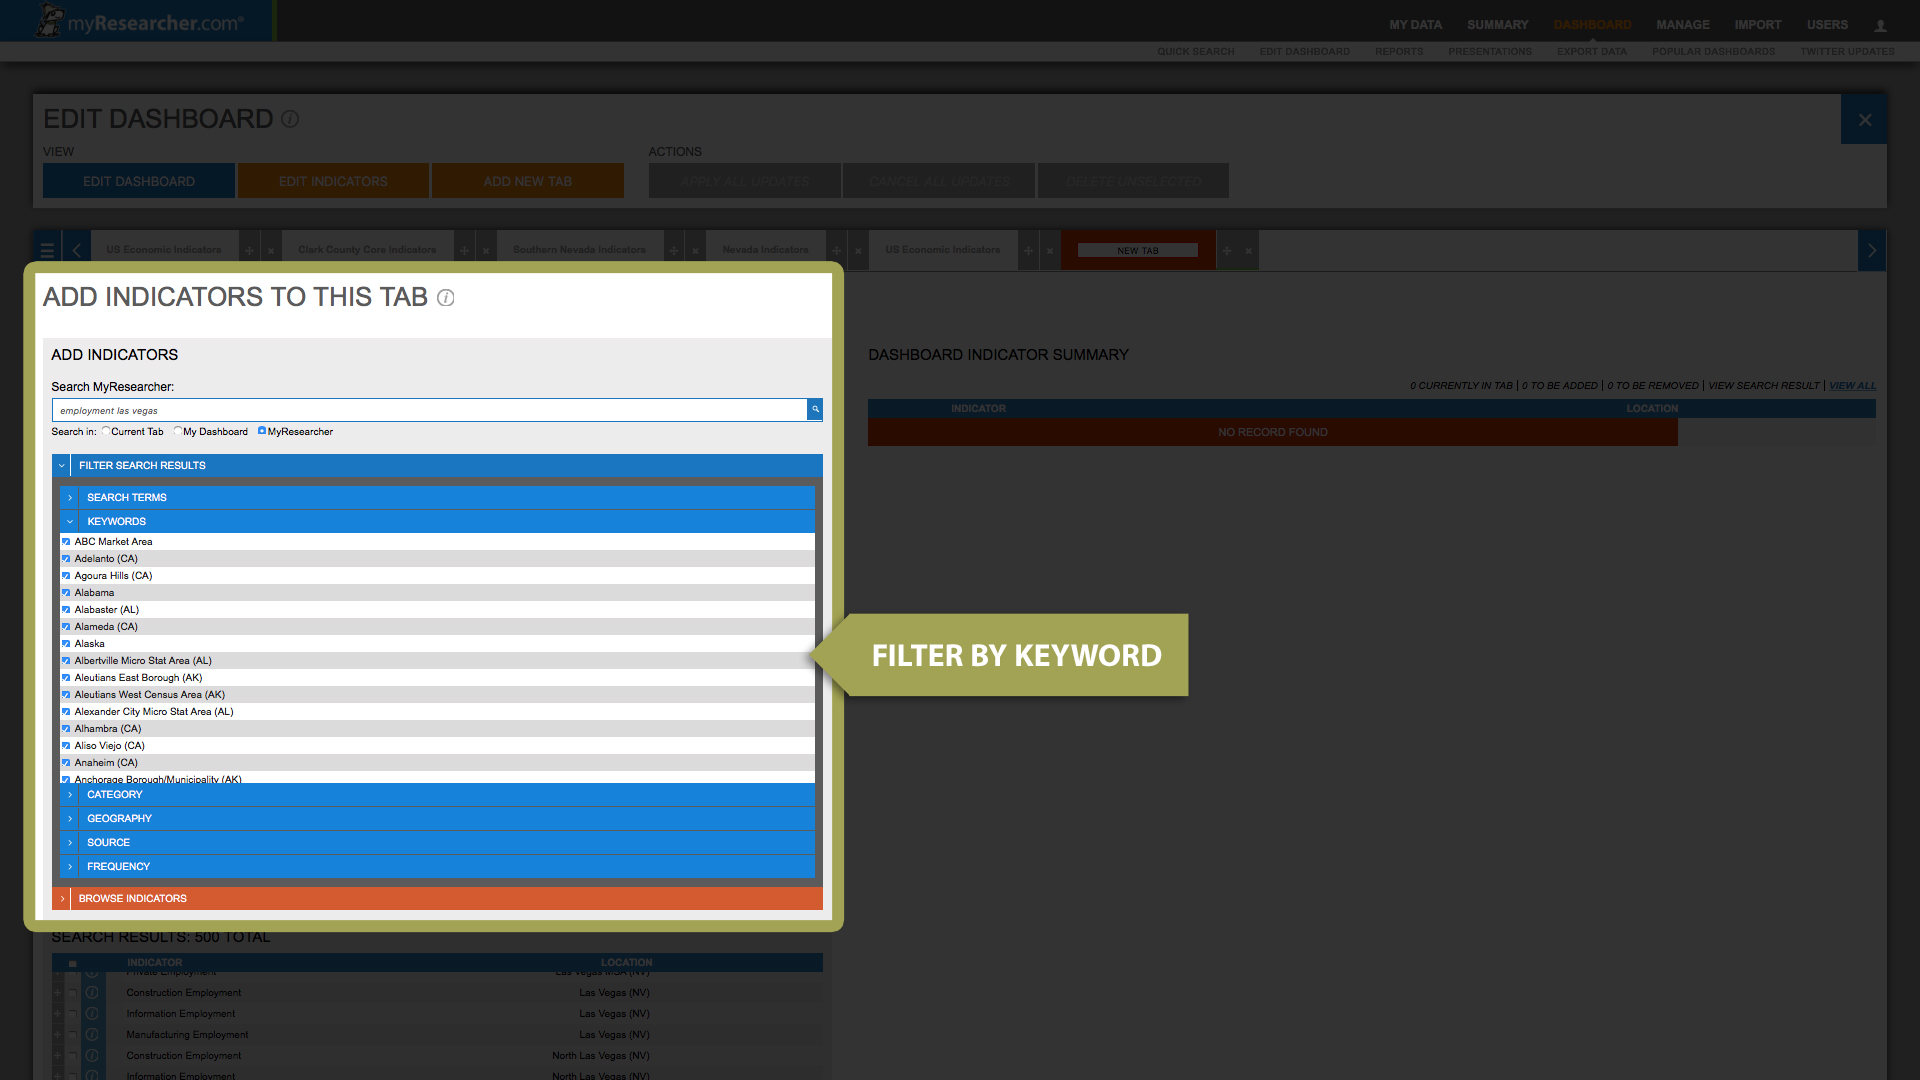
Once MyResearcher begins to recognize indicators that match your search, the search tool bar will provide the option to either filter your search results or to browse indicators.
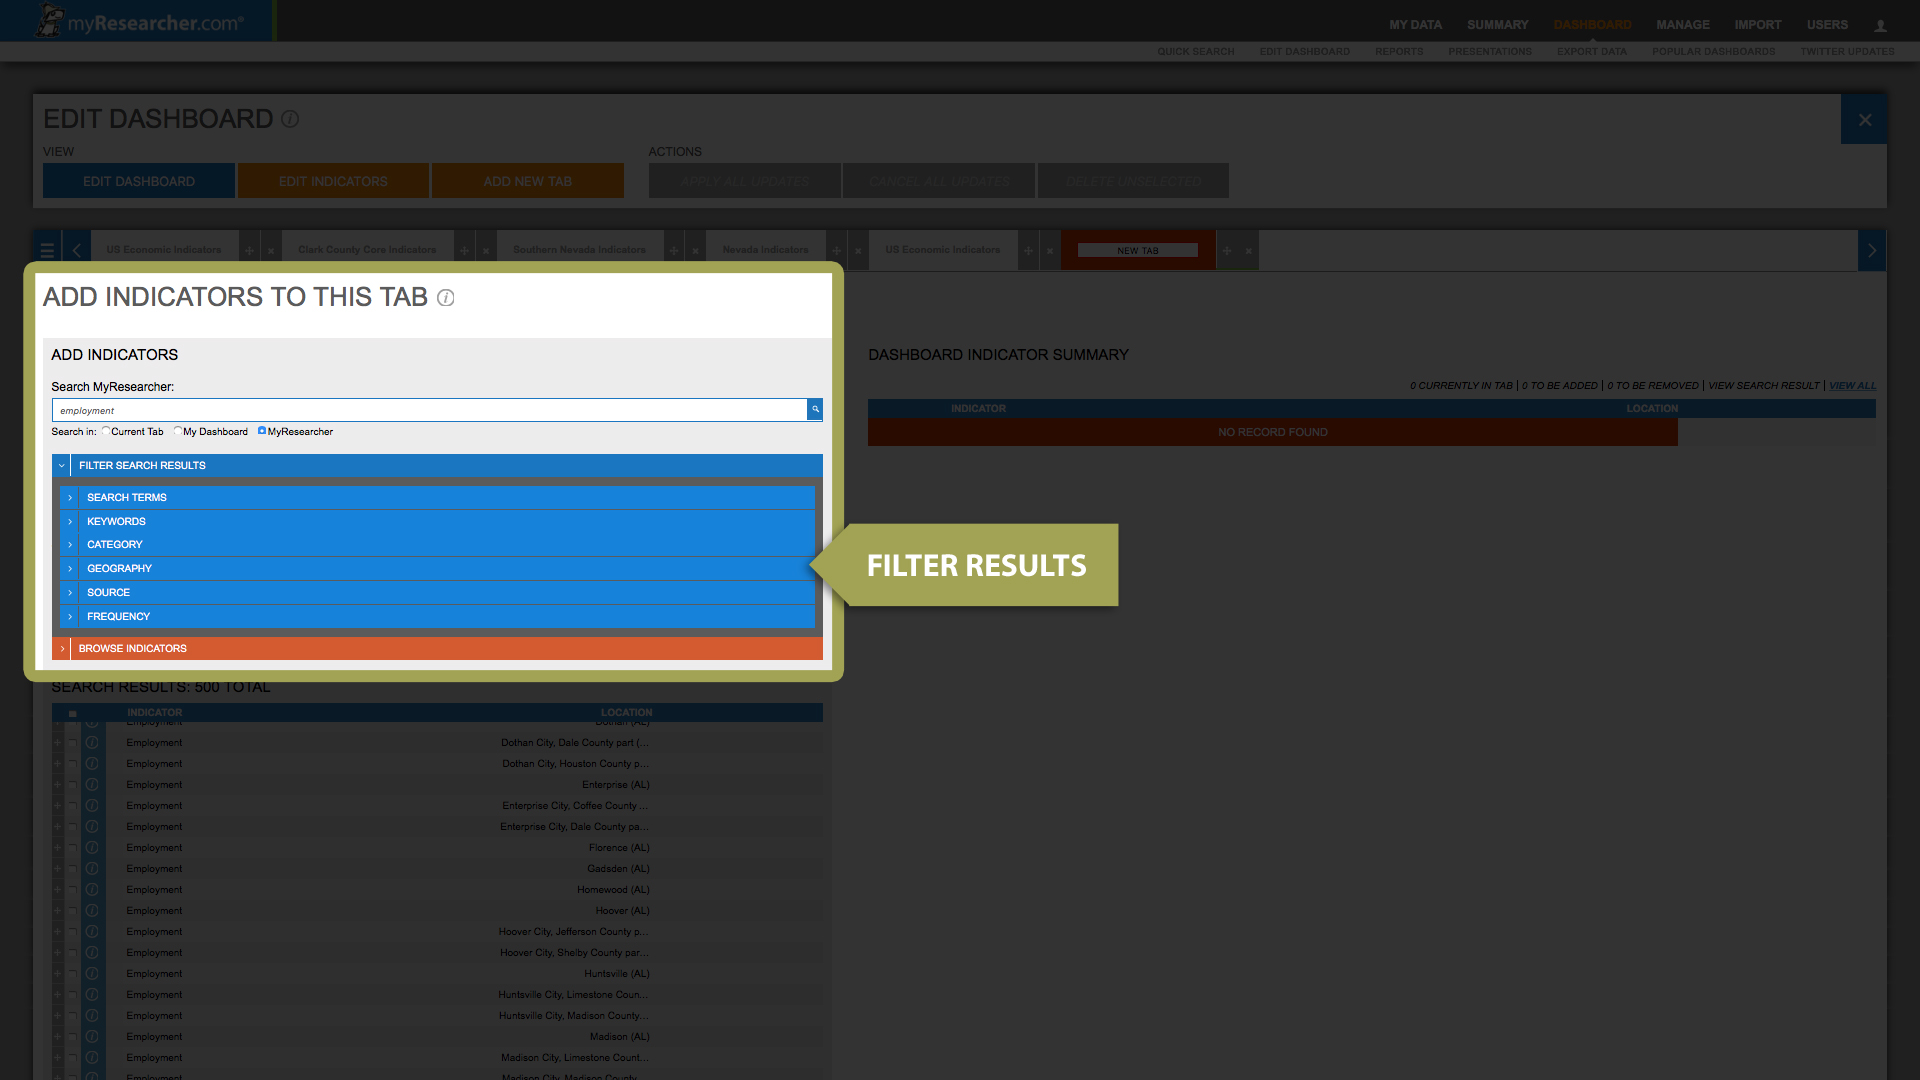
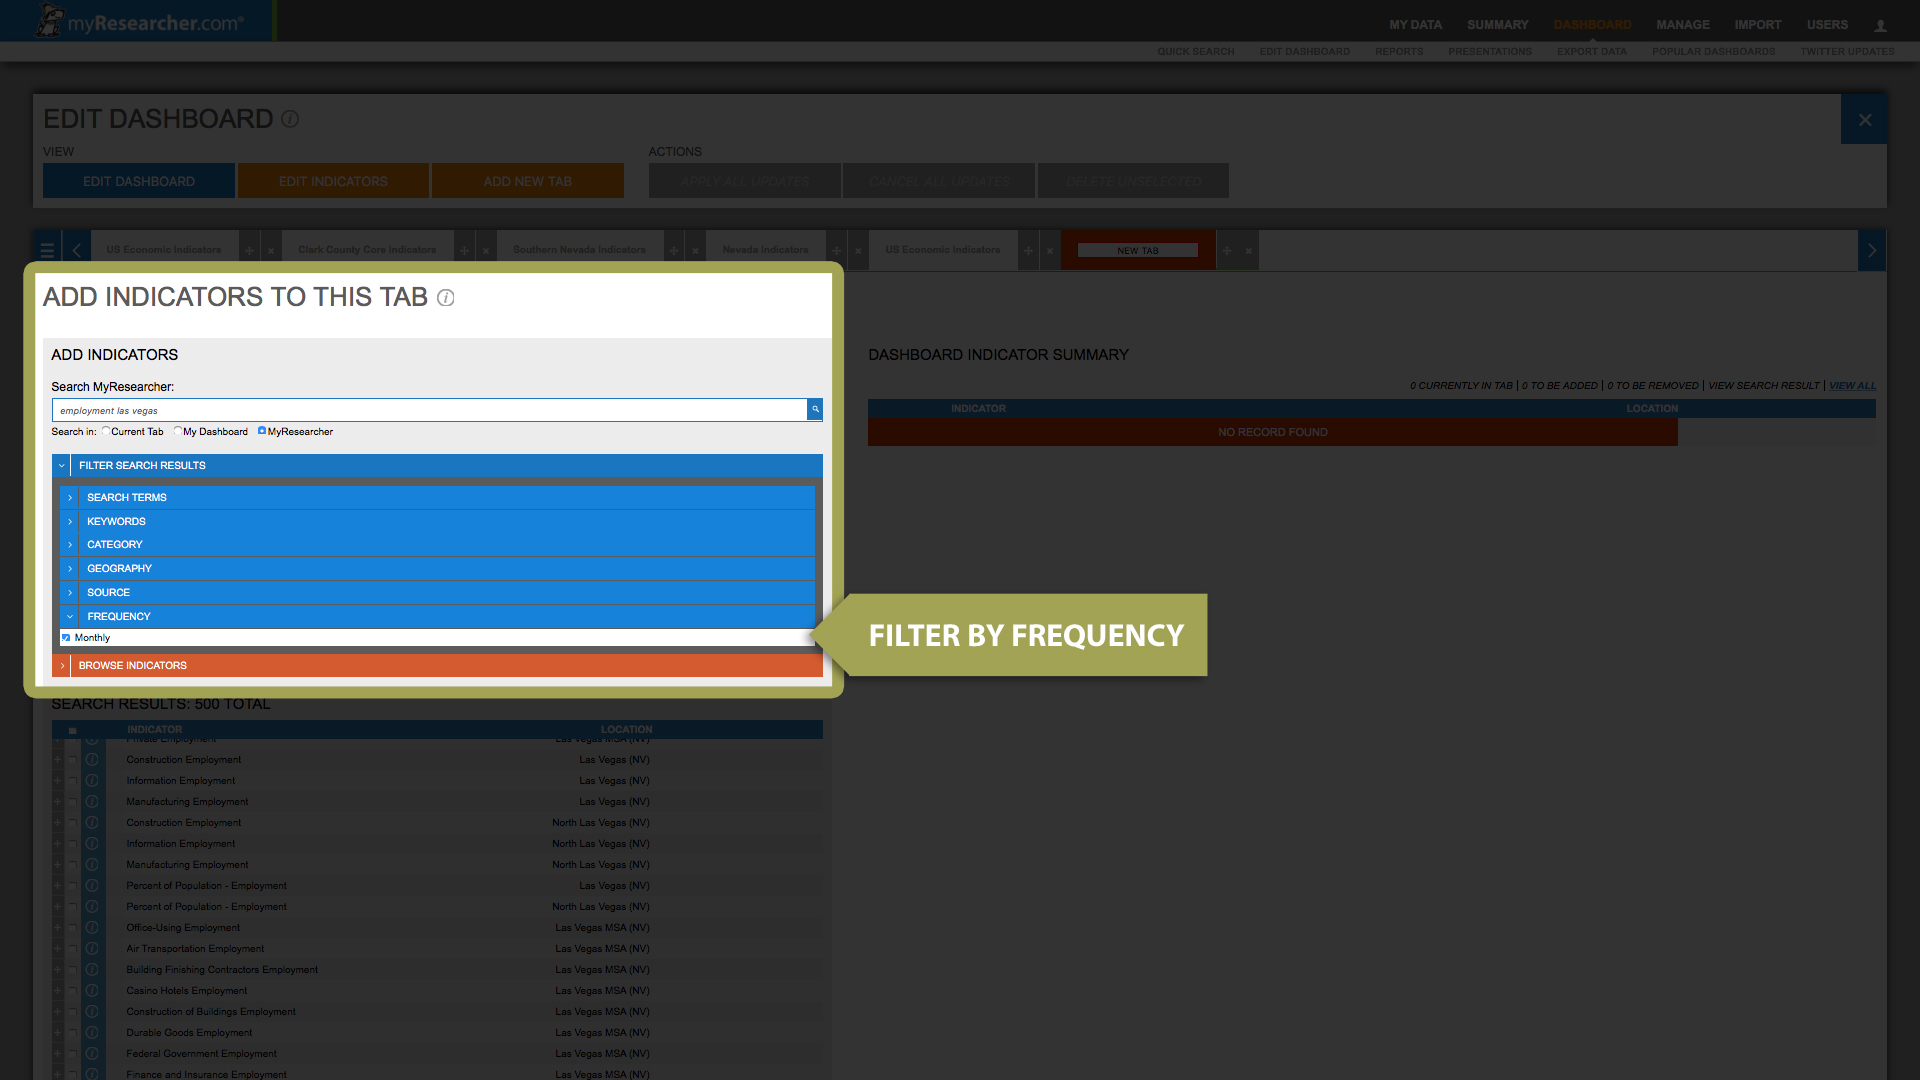
FILTER SEARCH RESULTS
There are six filter options: (1) Filter Search by Search Terms; (2) Filter Search by Keywords; (3) Filter Search by Category; (4) Filter Search by Geography; (5) Filter Search by Source; and (6) Filter Search by Frequency.
Selecting “Search Terms” will reveal each term that you have typed into the search bar. Unchecking boxes next to individual search terms will further filter your indicator search.

Selecting “Keywords” will reveal indicators with the same or similar words or phrases. Unchecking boxes next to keywords that you are not interested in will further filter your indicator search results.
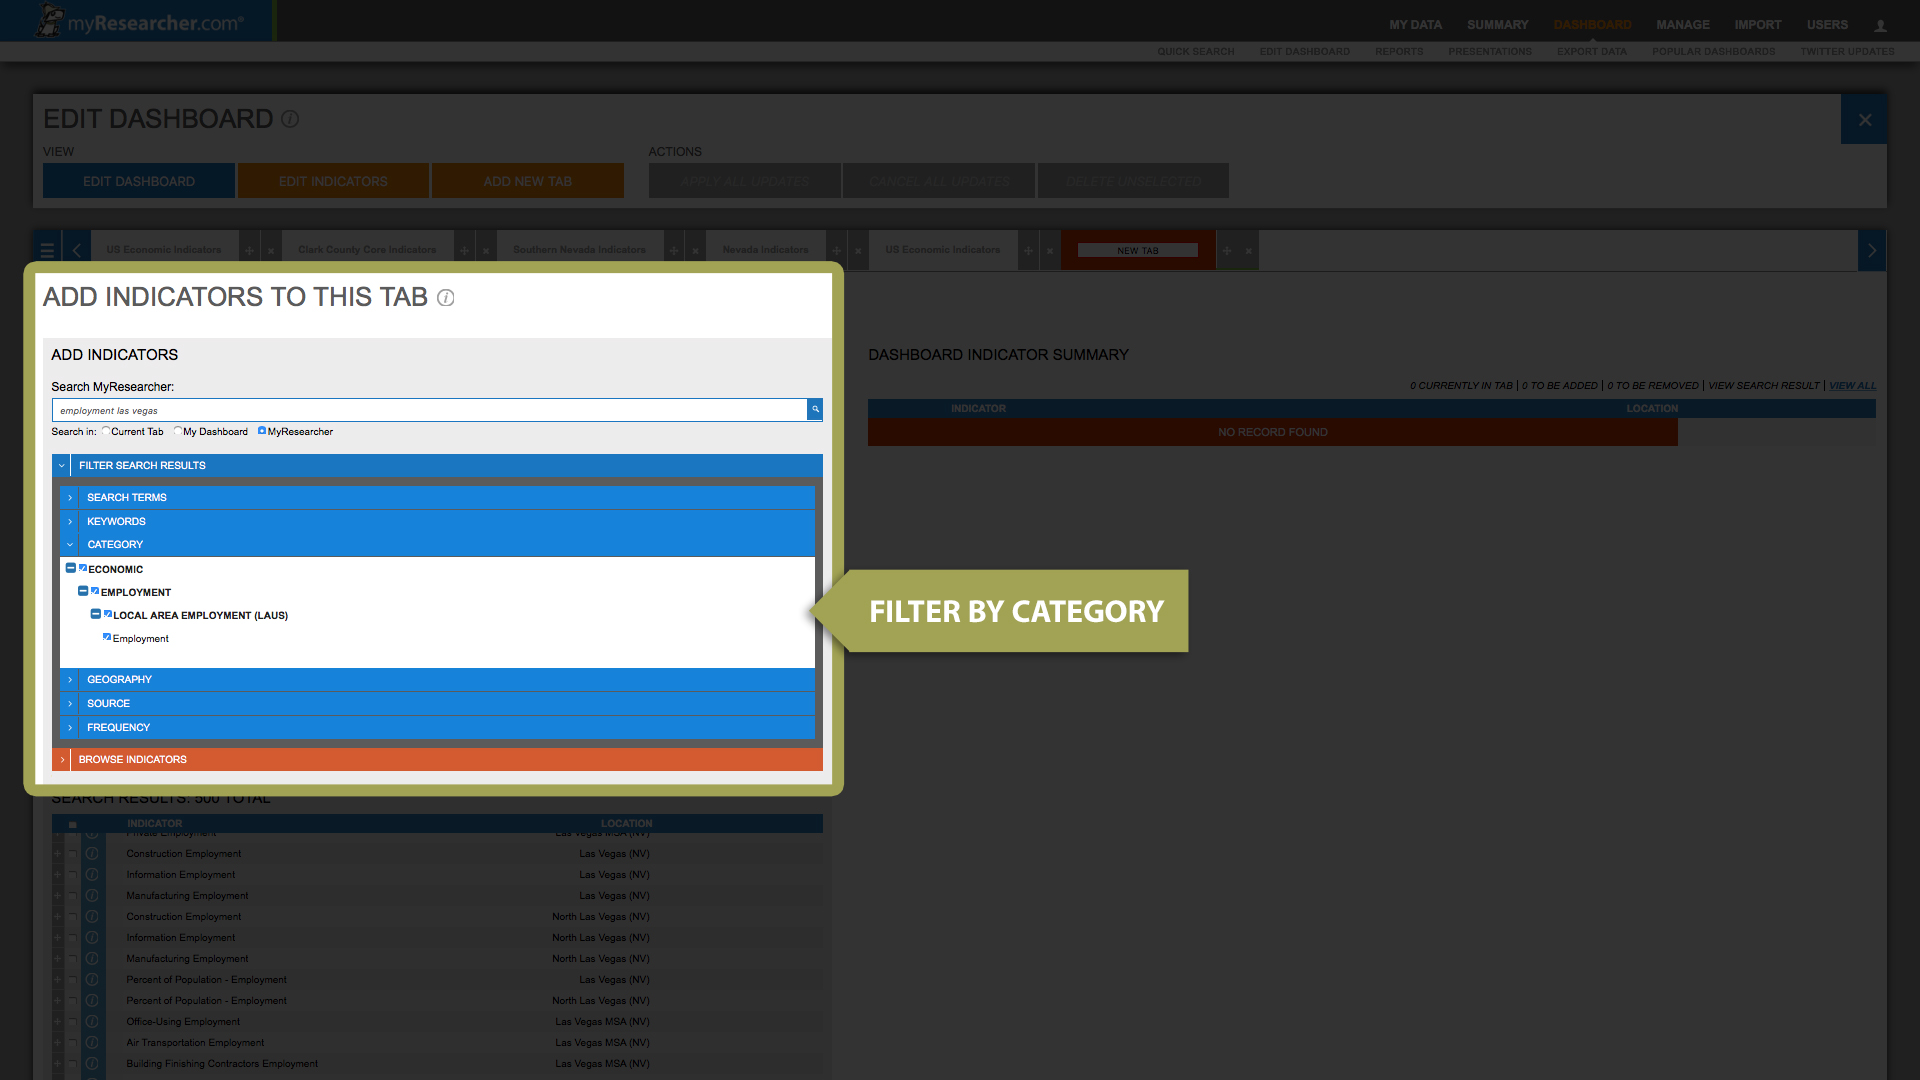
Selecting “Category” will reveal the category selector. Selecting the “+” sign next to the category will reveal the subcategories for further filtration of the search should they be available, and selecting the “-“sign will hide the subcategories.
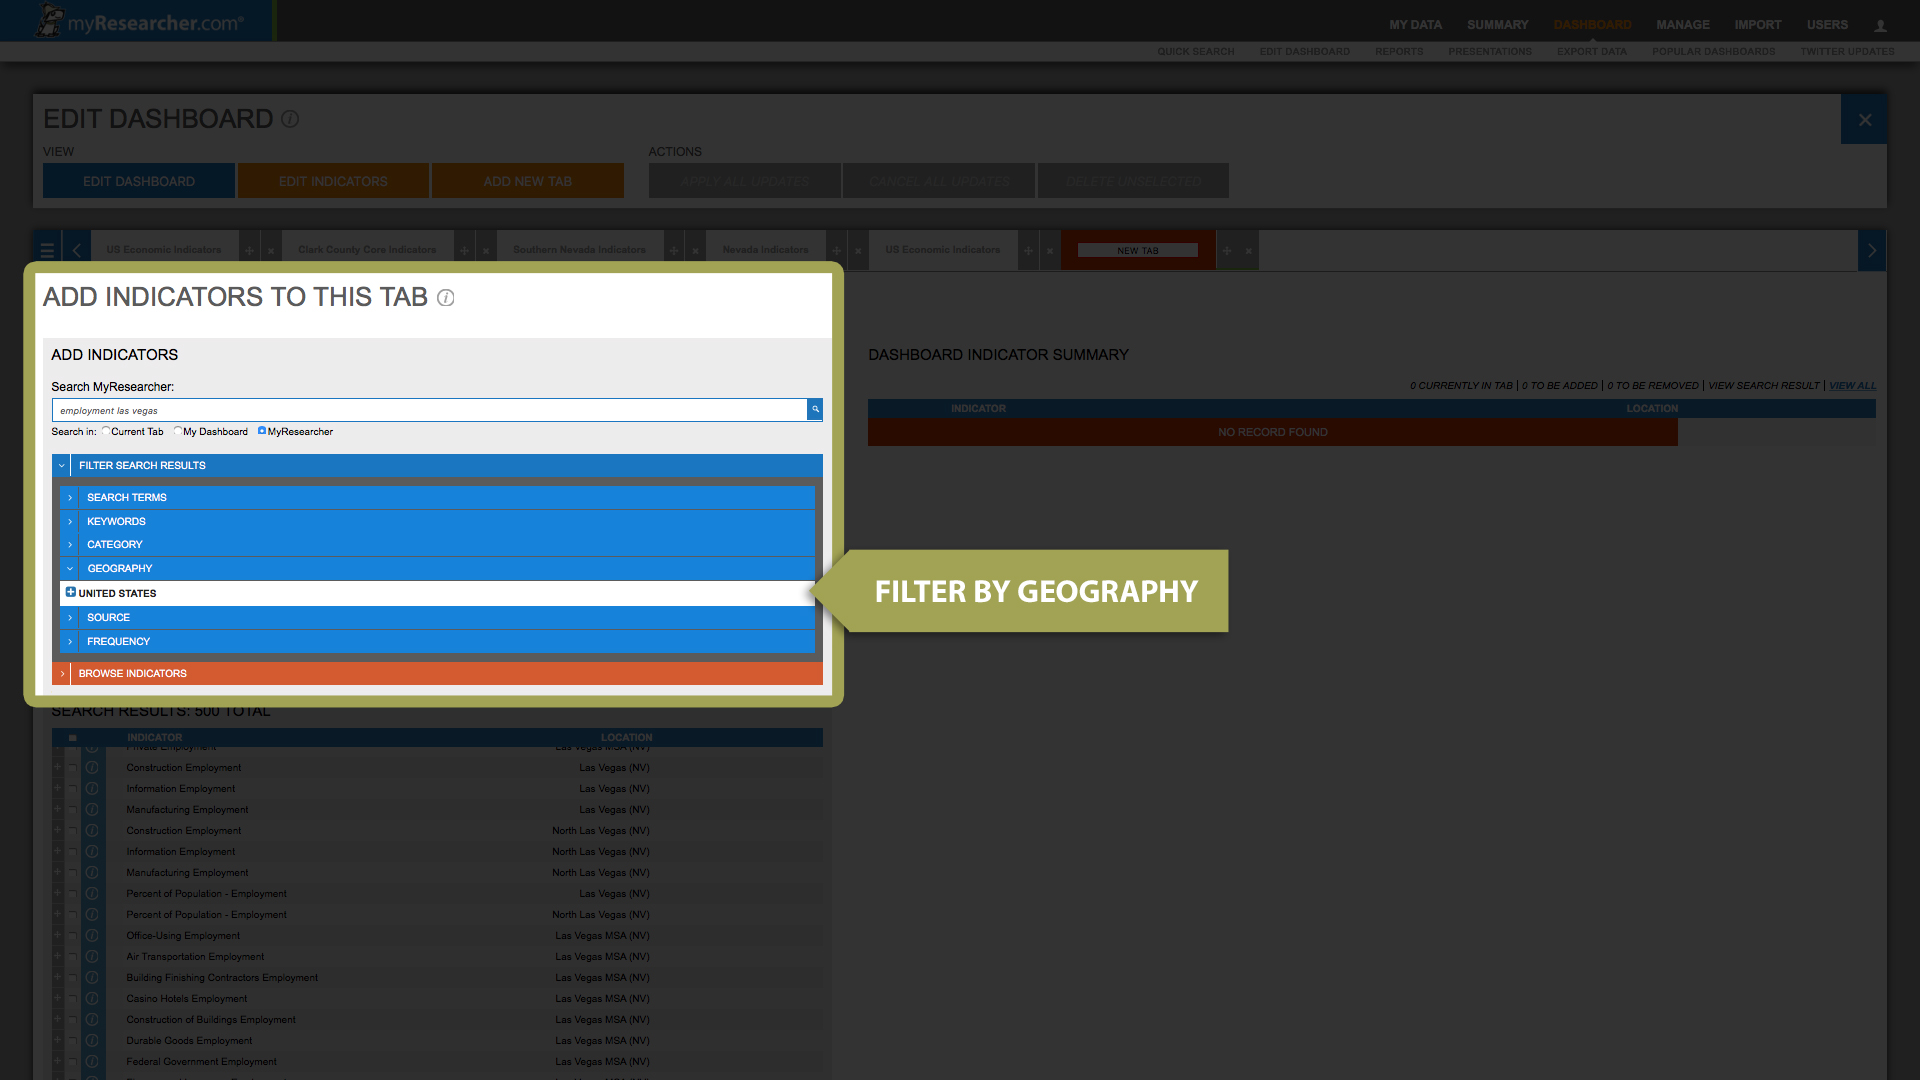
Selecting “Geography” will reveal the location selector. Selecting the “+” sign next to each location will reveal the subcategories for further filtration of the search.
Selecting “Source” will reveal the sources responsible for indicator data in your search results. Unchecking boxes next to sources that you are not interested in will further filter your indicator search results.
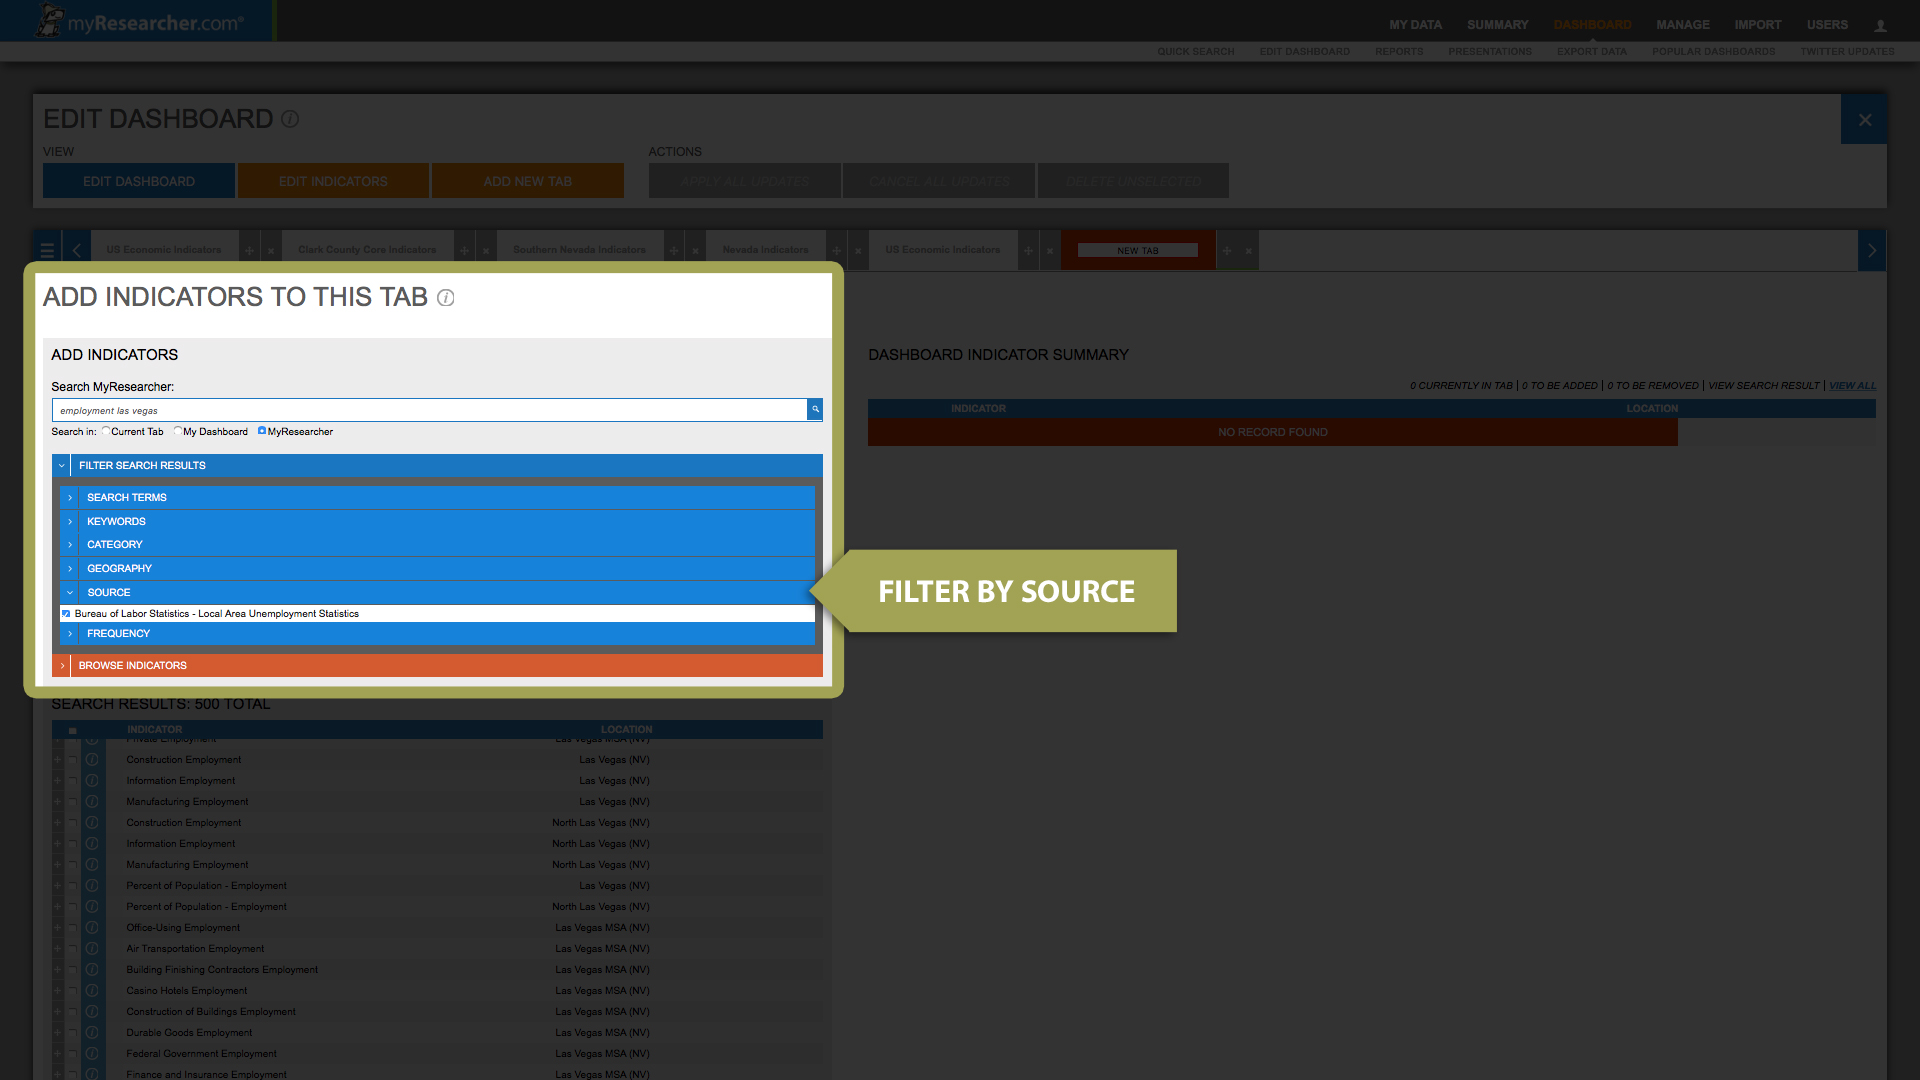
Selecting “Frequency” will reveal different periodicities for indicators in your search results. Unchecking boxes next to periodicities that you are not interested in will further filter your indicator search results.
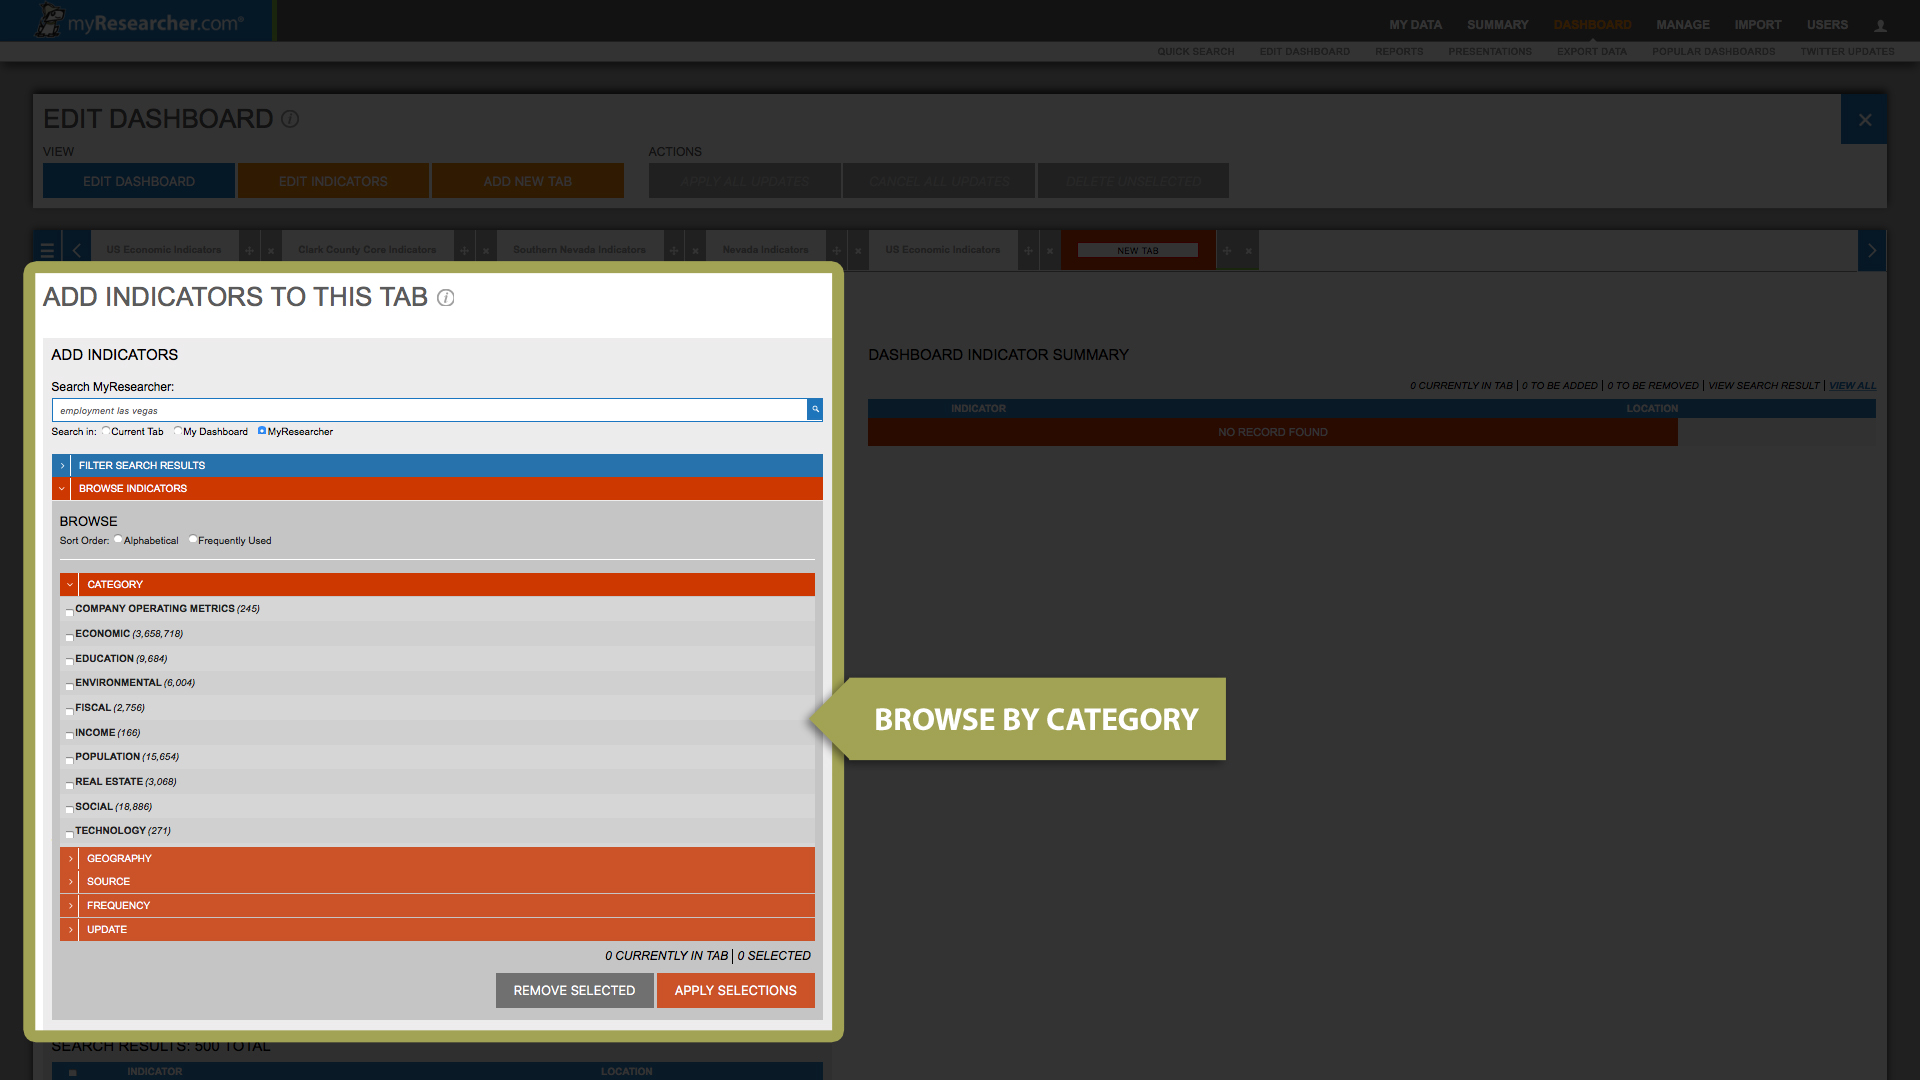
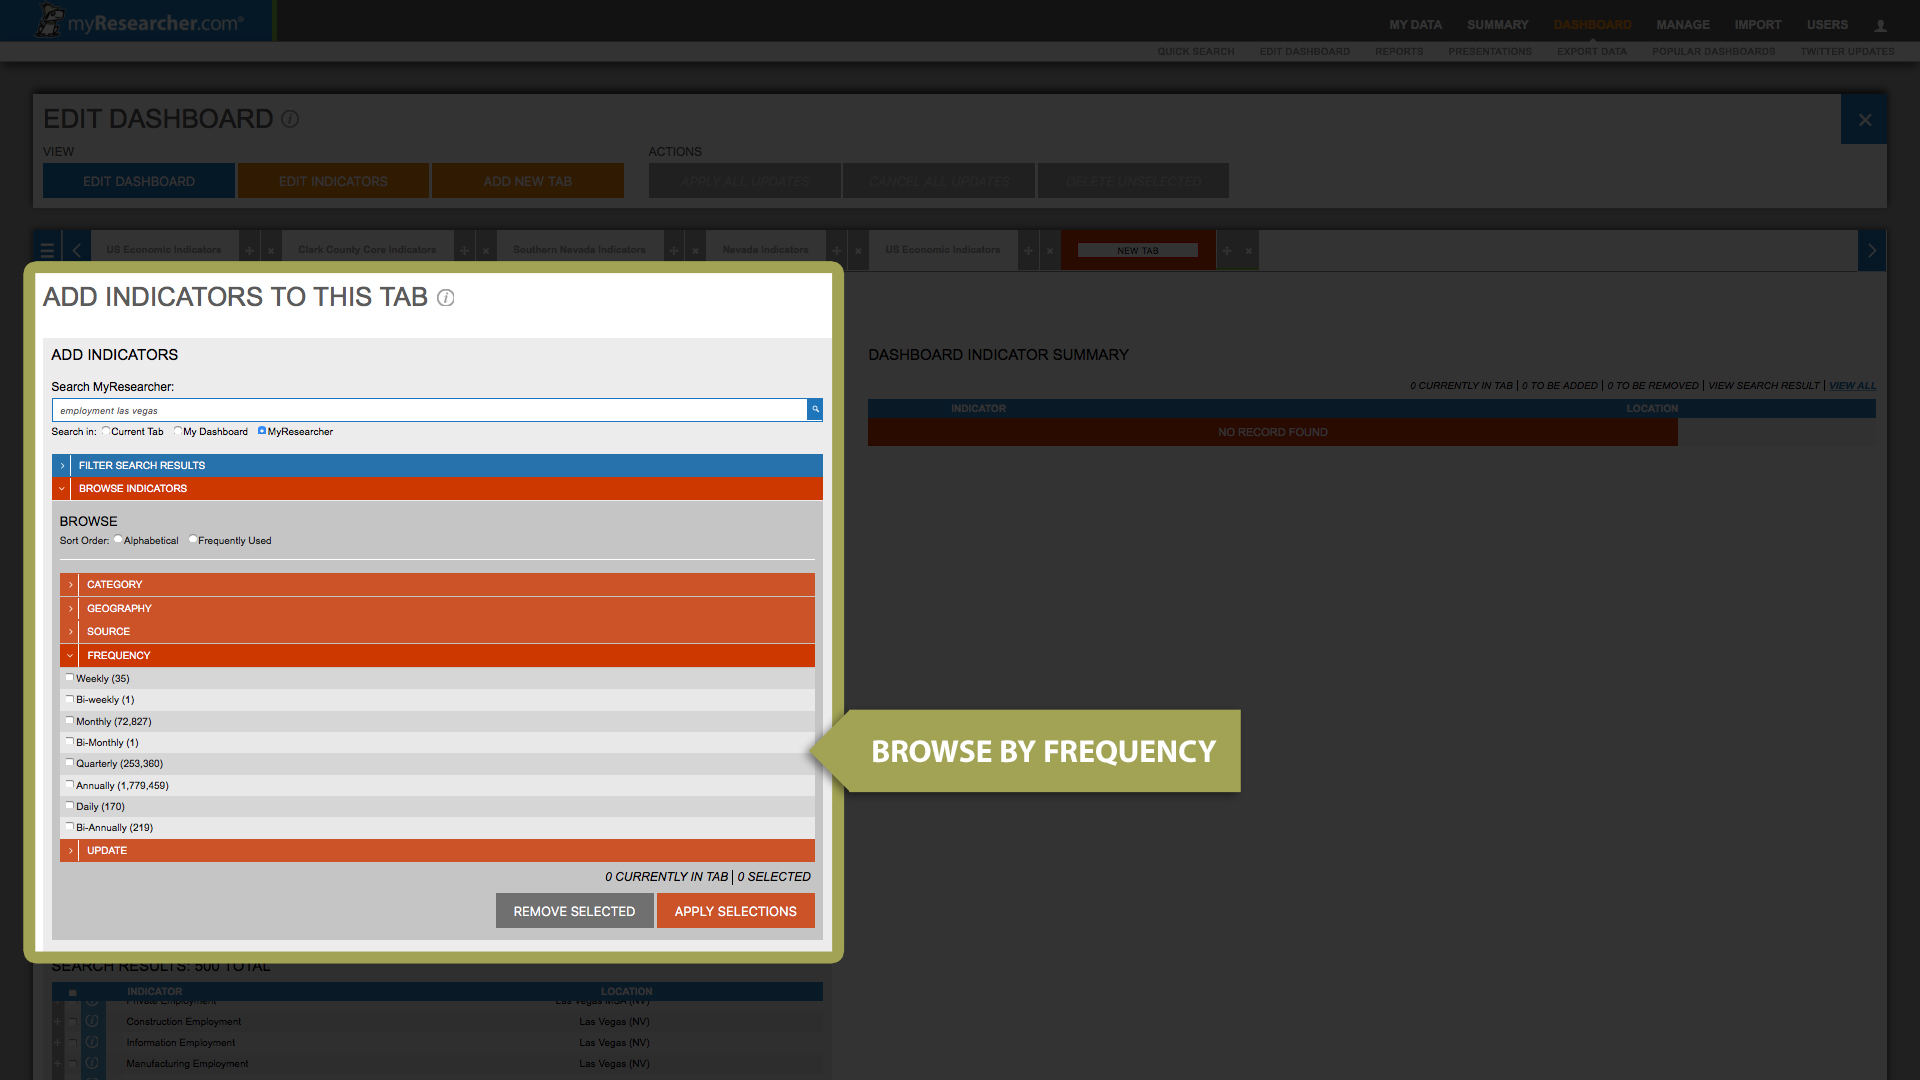
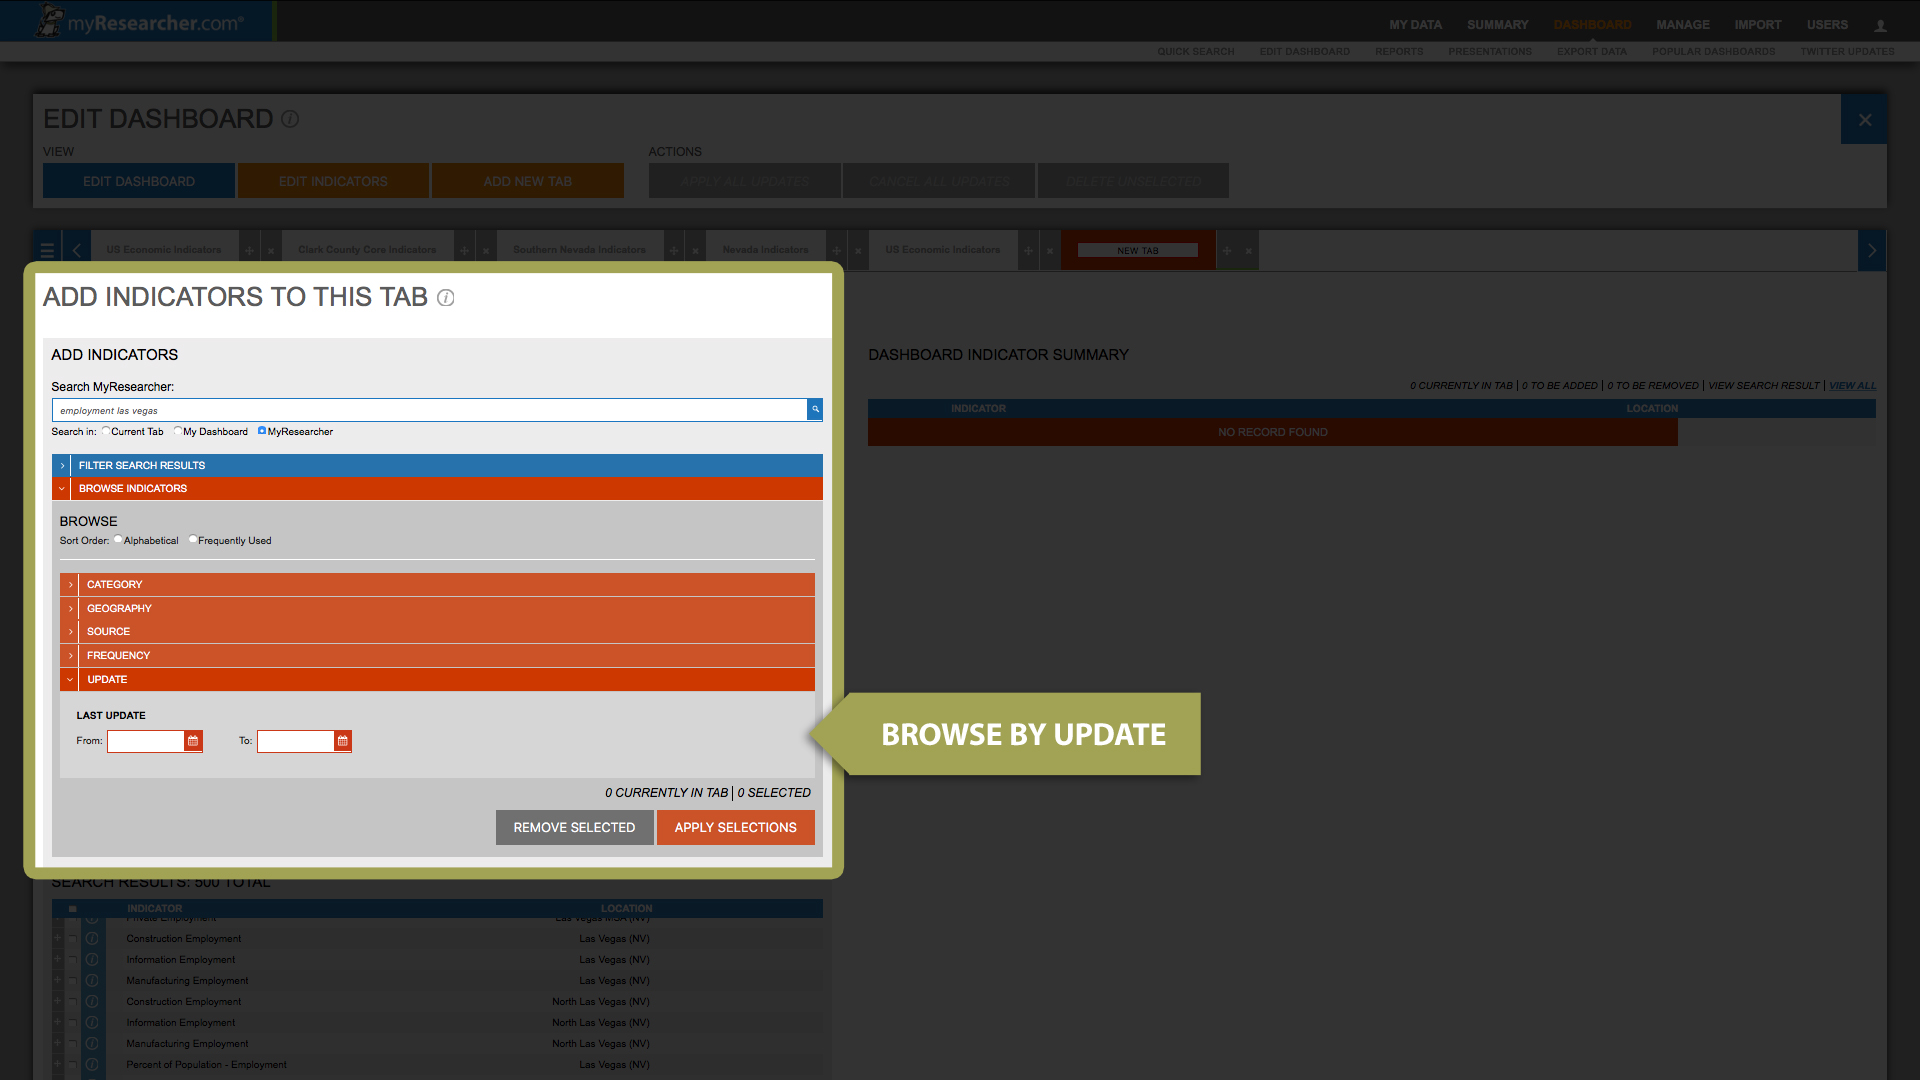
BROWSE INDICATORS
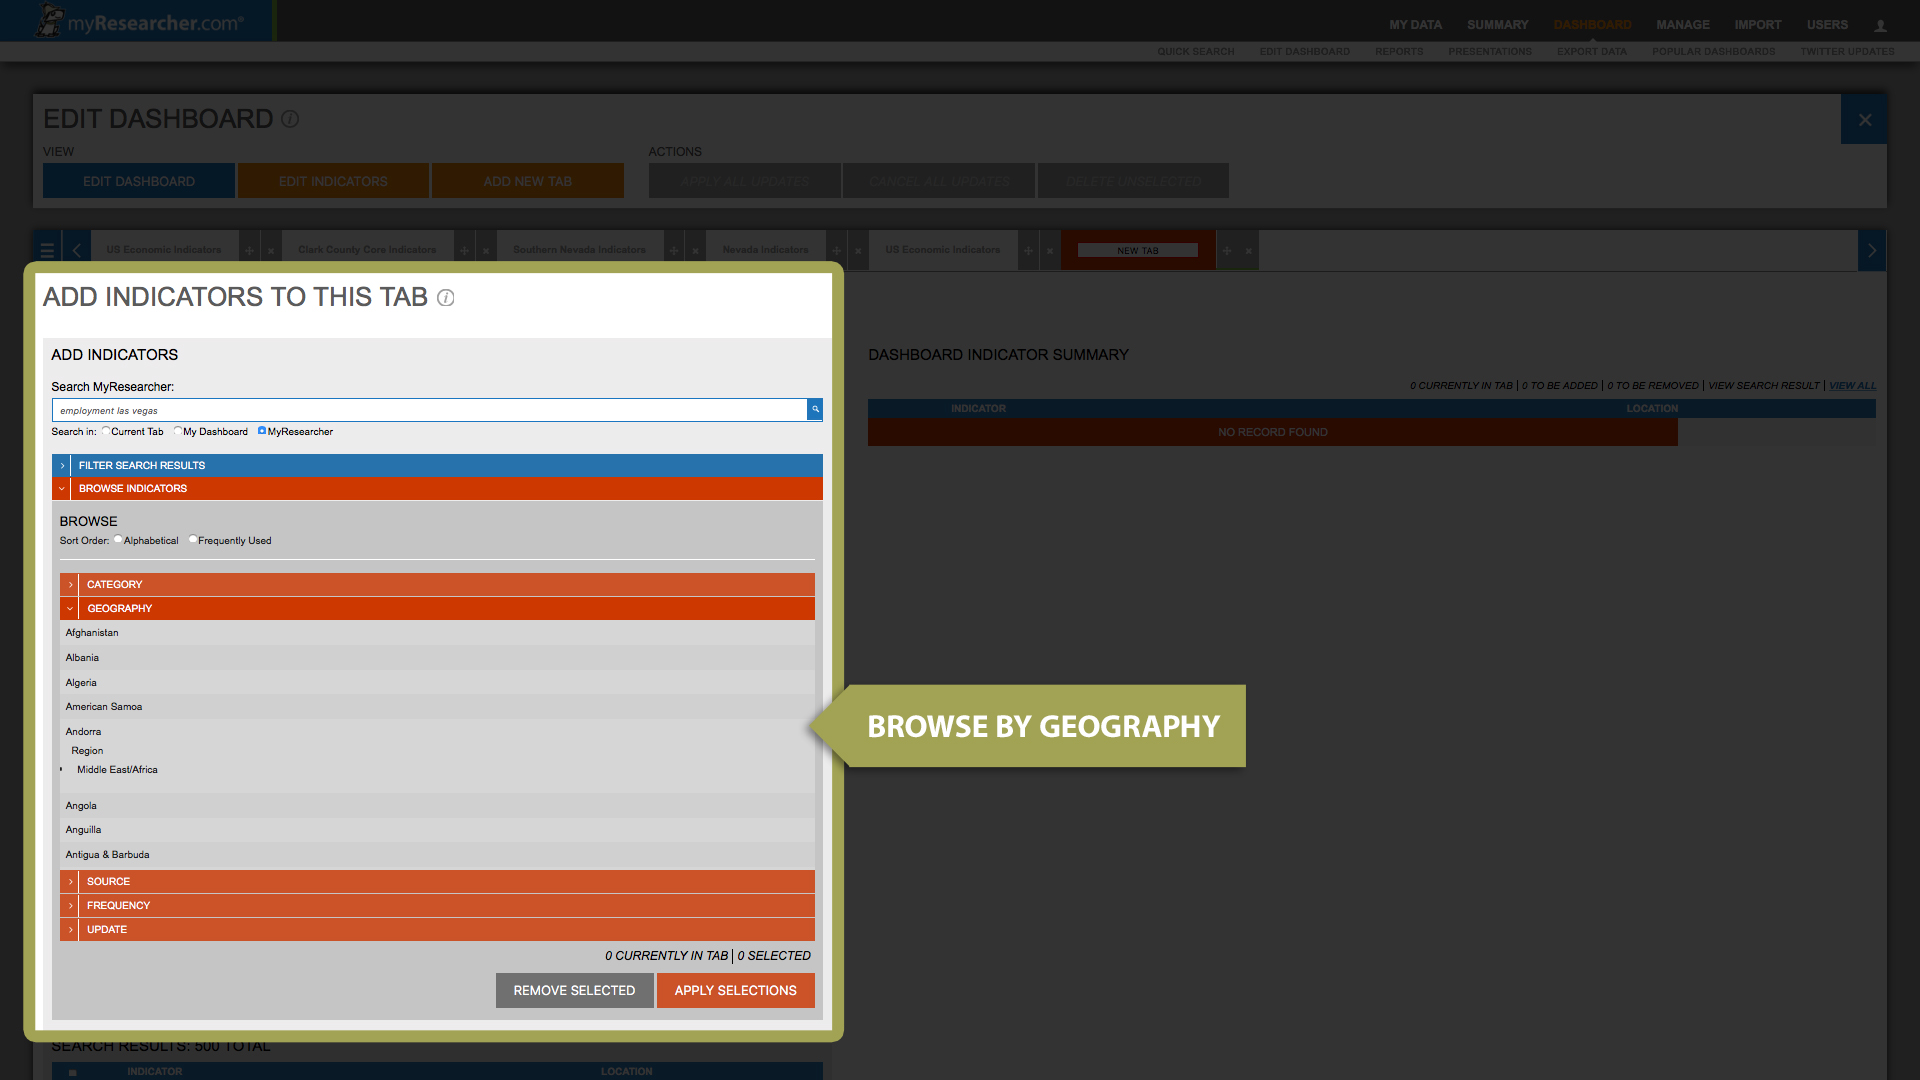
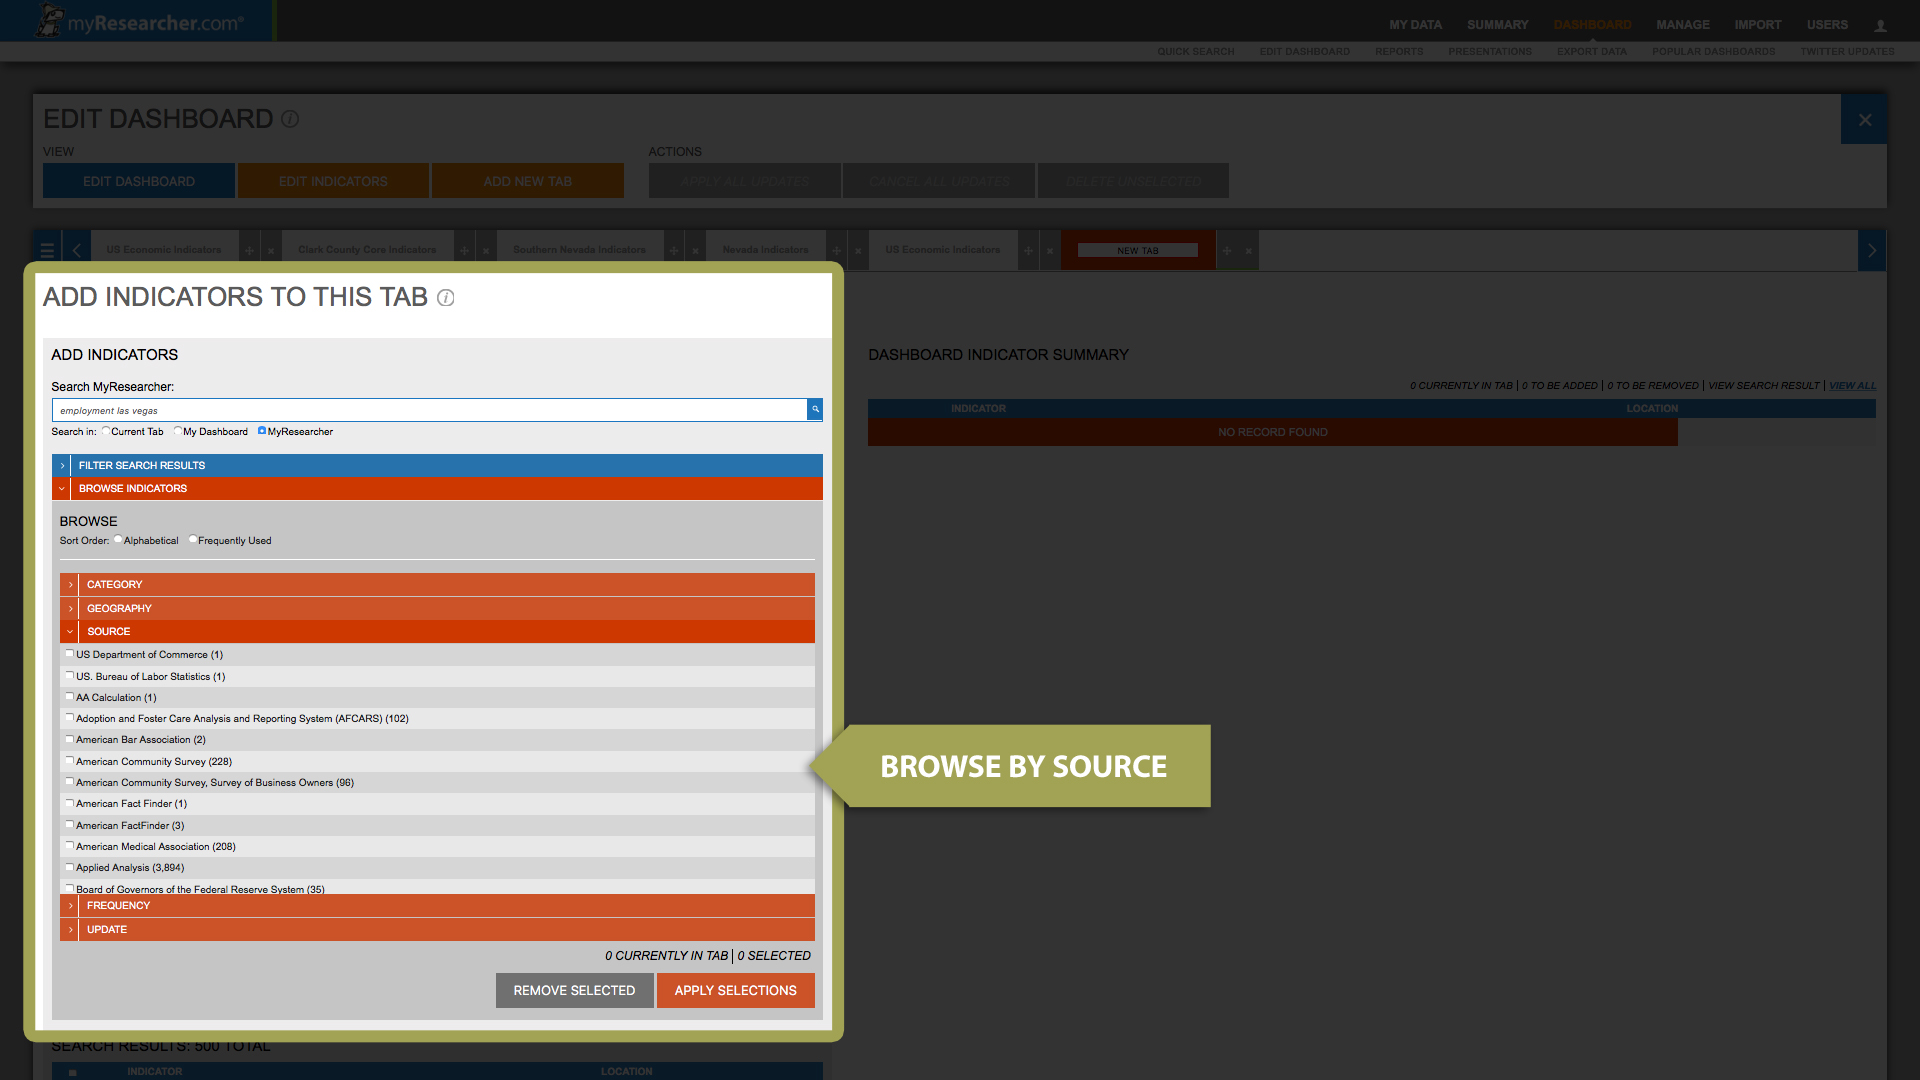
There are five indicator browsing options: (1) Browse by Category; (2) Browse by Geography; (3) Browse by Source; (4) Browse by Frequency; and (5) Browse by Update. You can also sort the order in which you browse indicators by alphabetical or most frequently used.
Selecting “Category” will reveal the category selector. Select the categories that you are interested in and click the “Apply Selections” button to browse indicators in these categories.
Selecting “Geography” will reveal the location selector. Select the location you are interested in and click the ‘Apply Selections” button to browse indicators for that location.
Selecting “Source” will reveal the different sources responsible for indicator data in Myresearcher. Checking boxes next to sources that you are interested in will filter your search results so that only indicators with data from these sources are shown. Click the “Apply Selections” button to browse indicators that meet your source criteria.
Selecting “Frequency” will reveal different periodicities for indicators in Myresearcher. Select the periodicities that you are interested in and click the “Apply Selections” button to browse indicators that meet your frequency criteria.
Selecting “Update” will allow you to enter a range of dates for indicators that were last updated within this range. Once you have entered the range of dates you are interested in, click the “Apply Selections” button to browse indicators that were last updated within this range.
Once you have selected indicators, the “Apply All Updates” and “Cancel All Updates” buttons will become active. Once the changes are applied or cancelled, the user can close the Edit Dashboard Toolbar and return to their Dashboard.

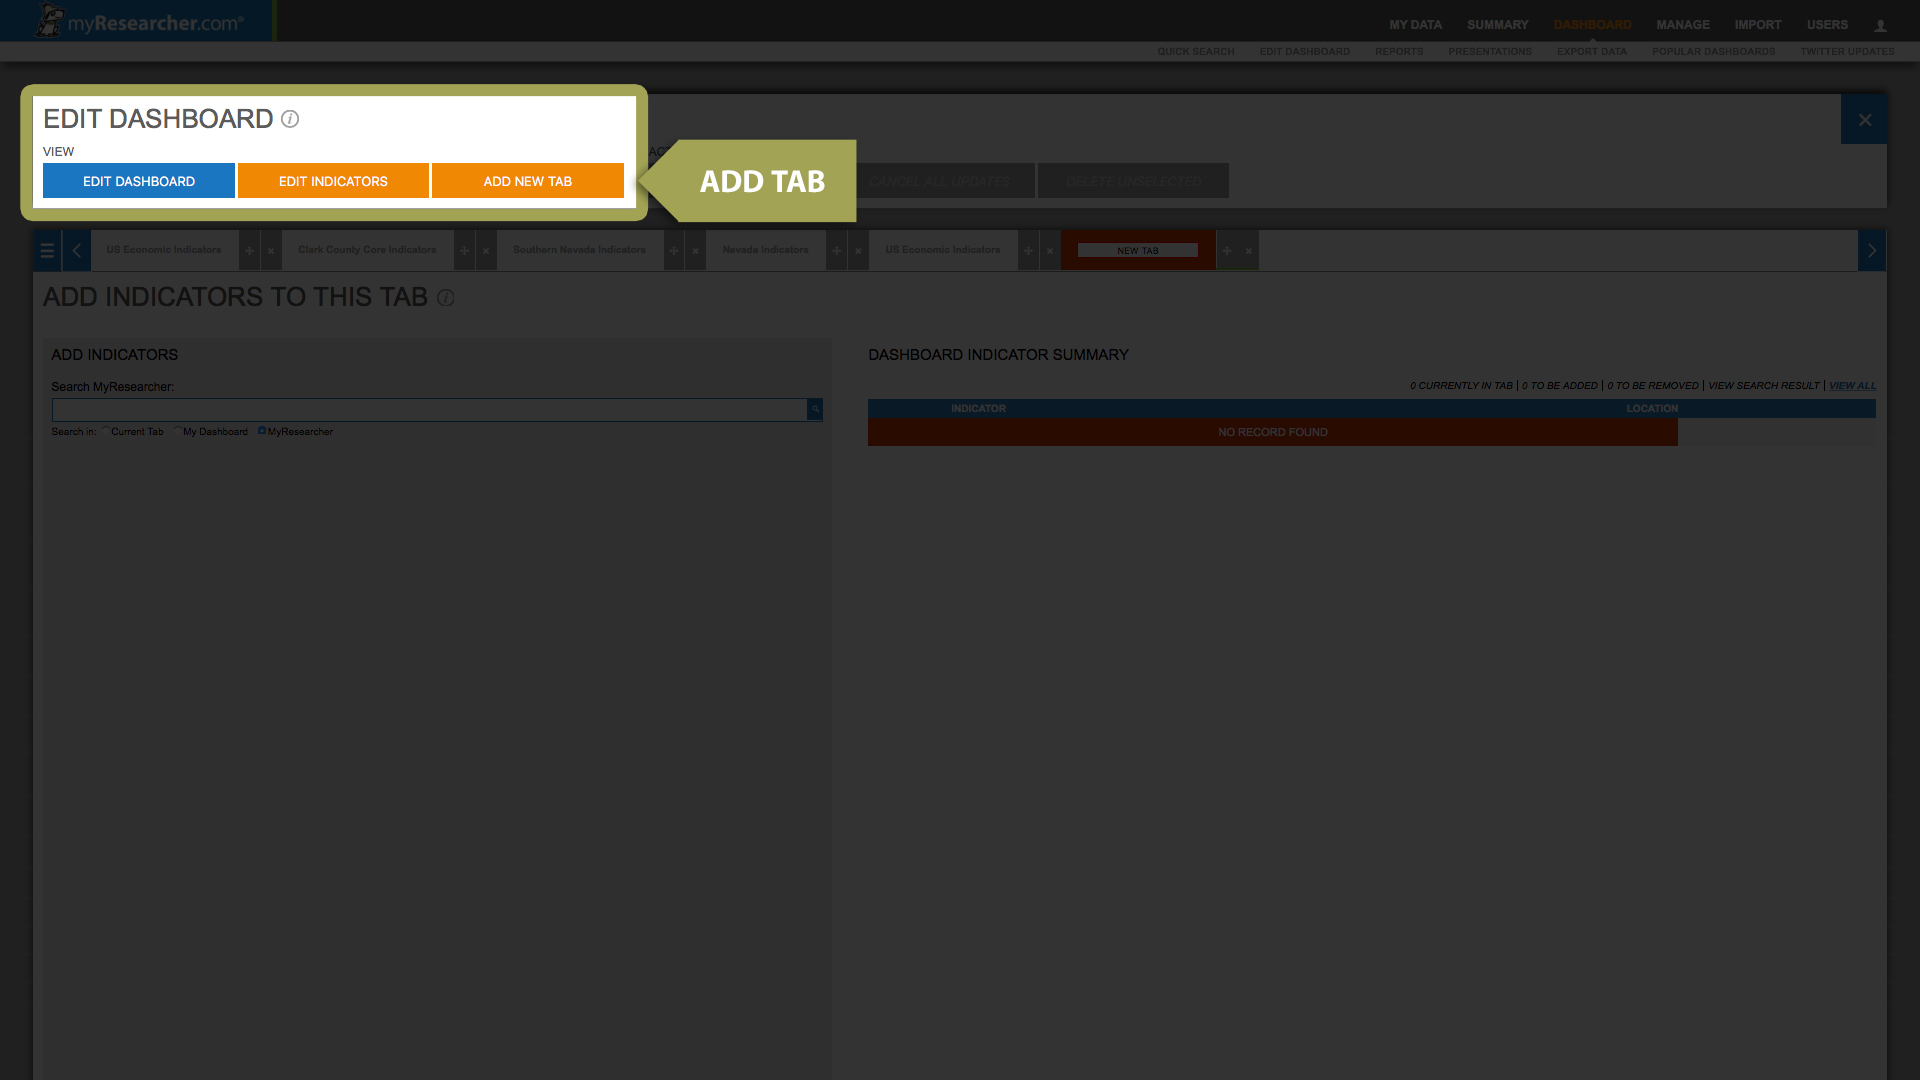
From the “Dashboard” menu at the top of the page, click on the “Edit Dashboard” button in the submenu. This will open the Dashboard Editor.
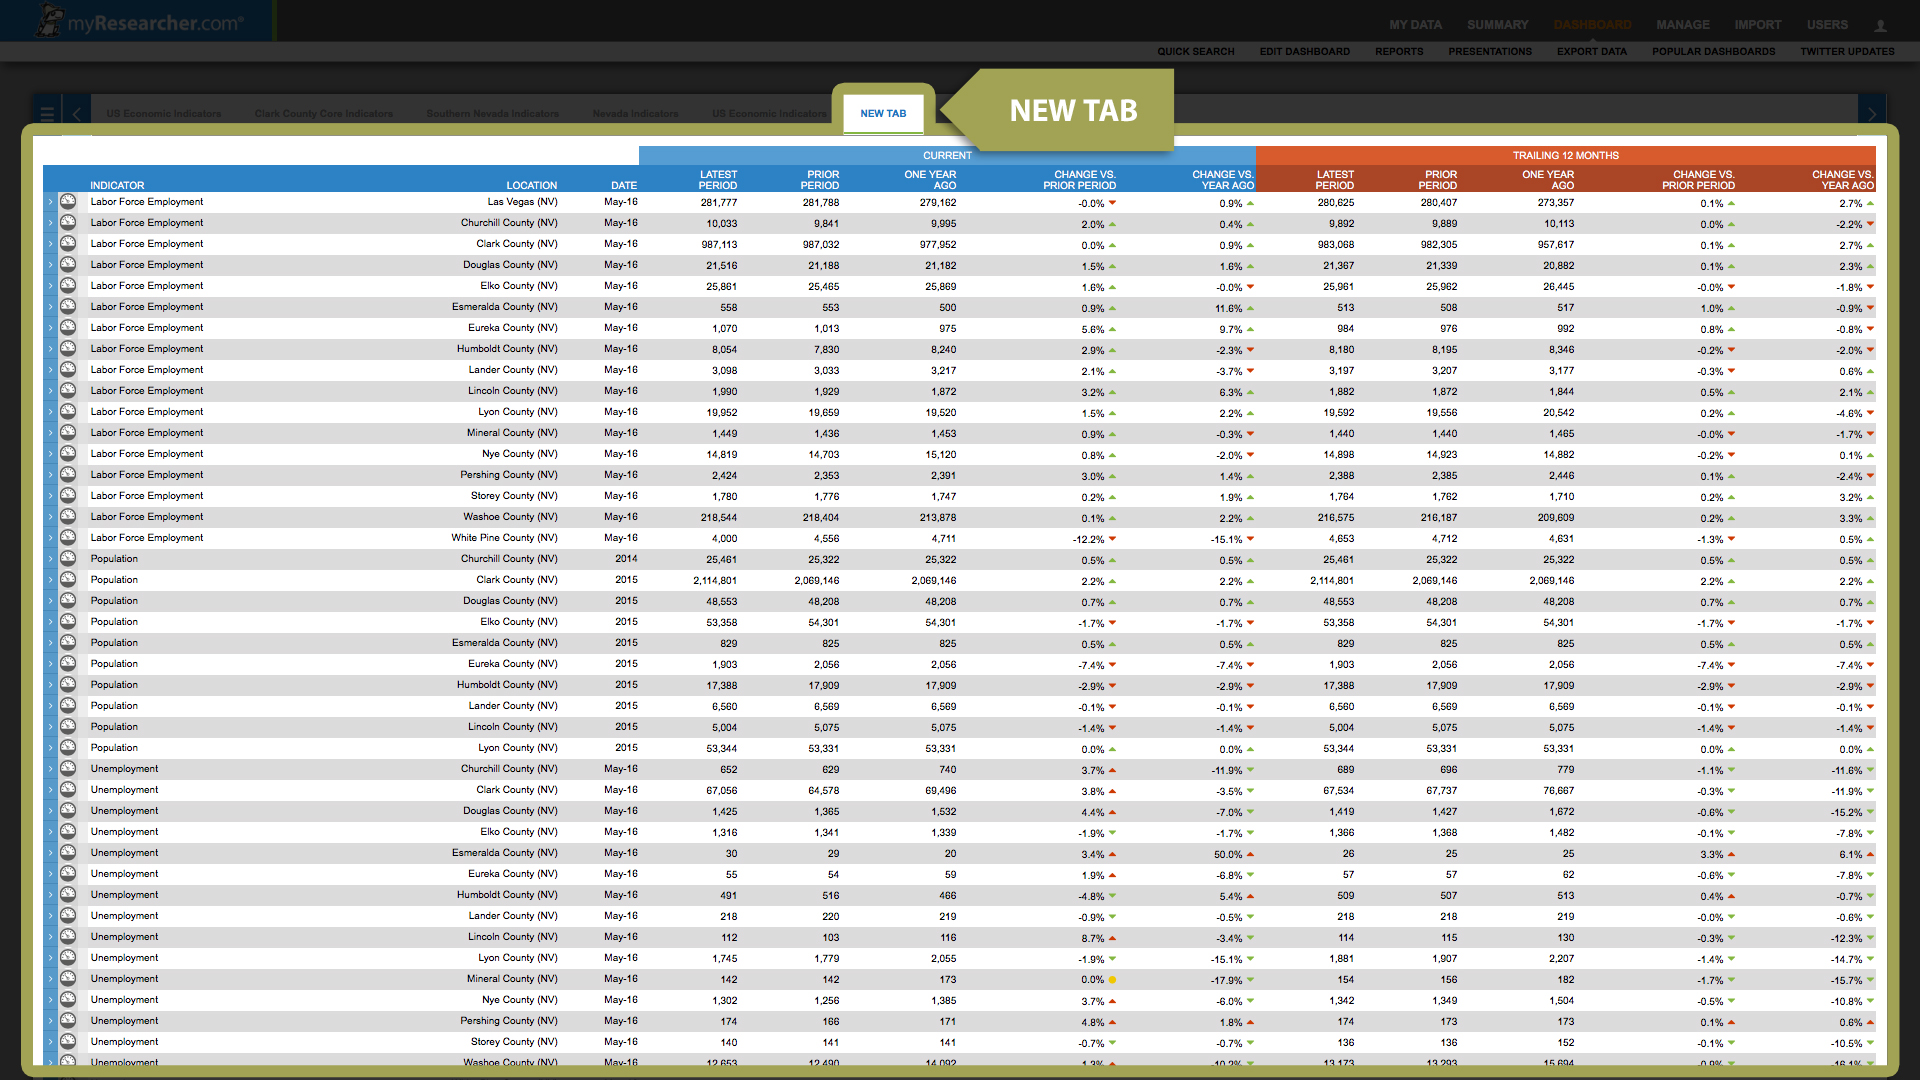
From the Dashboard Editor, select the “Add New Tab” button. This will create a new tab on the tab ribbon.
Name the newly created “Tab”.
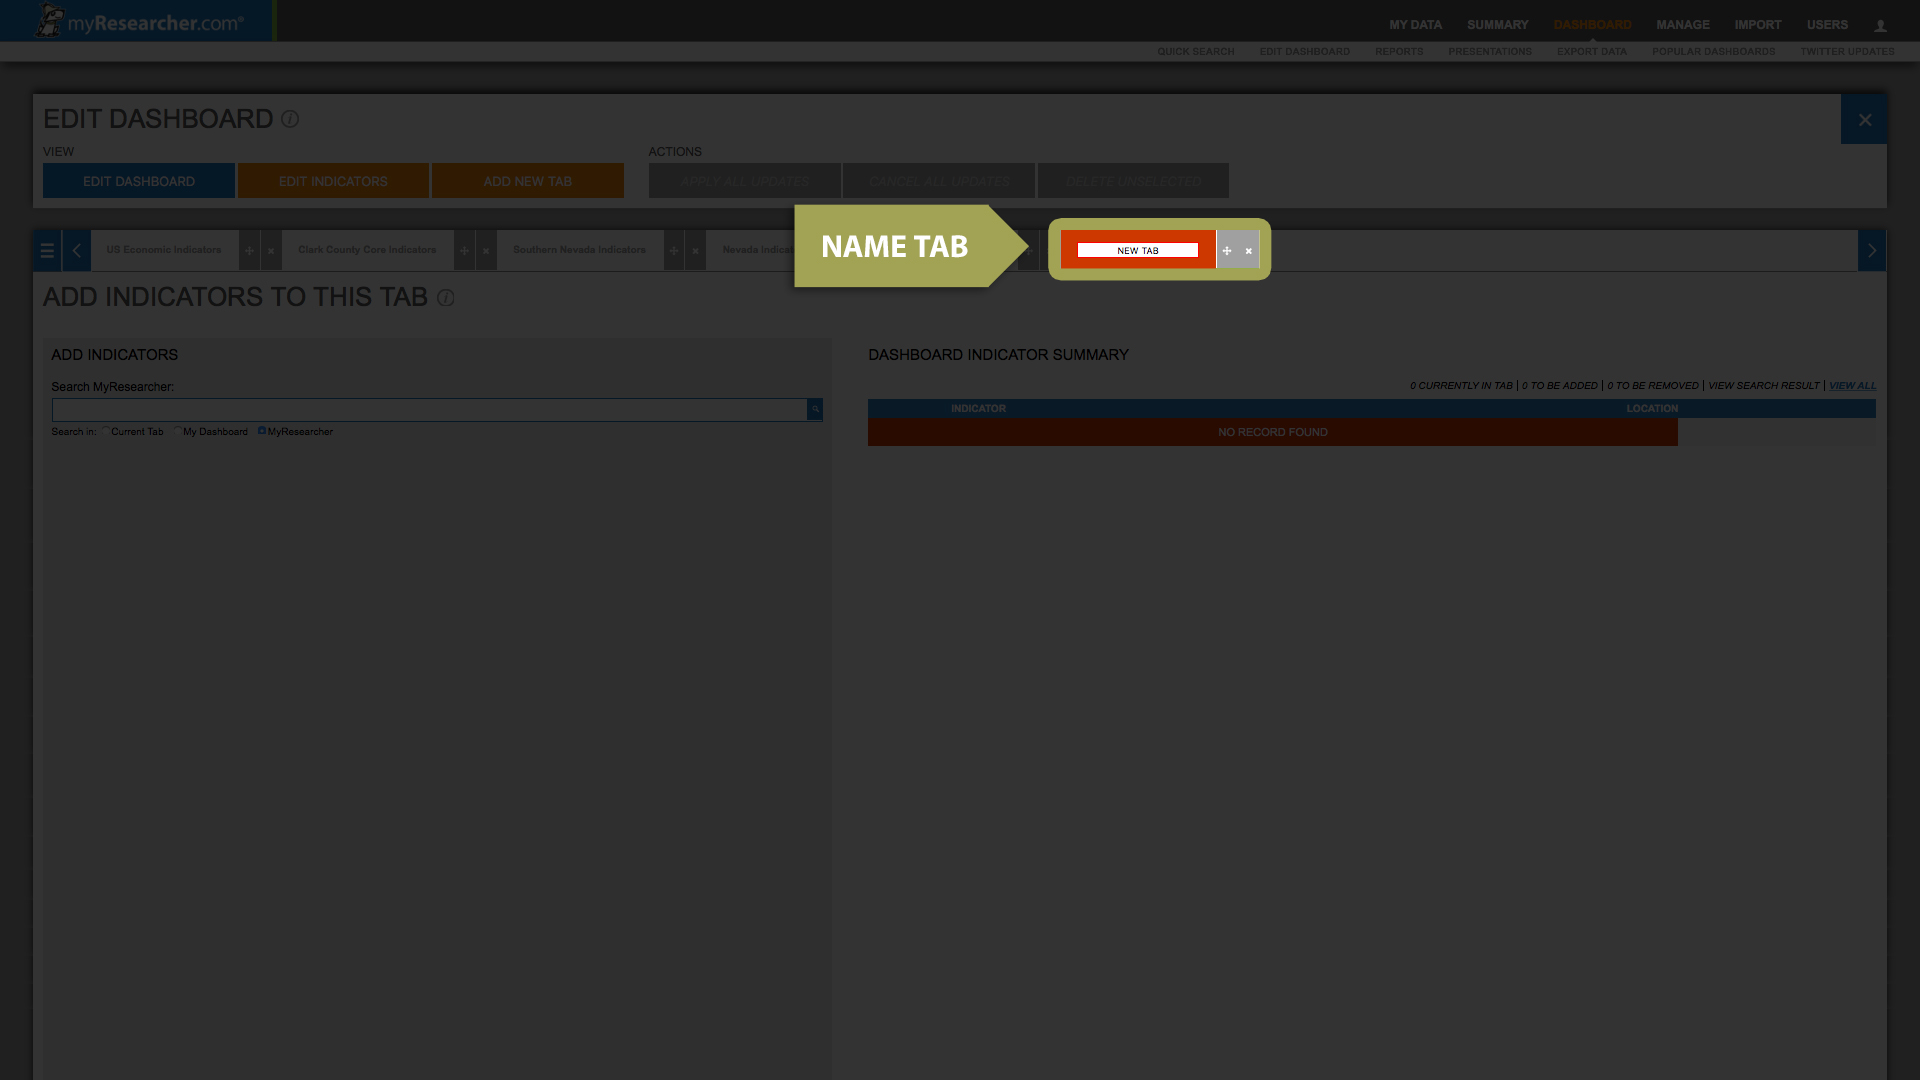
Once the new tab is created, add the indicators you would like track within that tab. This begins with an indicator search. How Do I Add New Indicators to MyResearcher Dashboard?
Once you have selected indicators, the “Apply All Updates” and “Cancel All Updates” buttons will become active. Once the changes are applied or cancelled, the user can close the Edit Dashboard Toolbar and return to their Dashboard. The new tab will be shown on the user’s MyResearcher Dashboard.
From your Dashboard click on the arrow next to the indicator you would like to learn more about. This will reveal a number of Dashboard options.
Select “Export Data.” This will reveal the Export Options menu. From the Export Options menu, select to export an active indicator, all indicators in the current tab or all indicators in the Dashboard.

Once Export Options are selected, choose a file format. Please keep in mind, that if your tab includes indicators with different periodicities (e.g., monthly and quarterly data), they can only be exported to MS Excel.

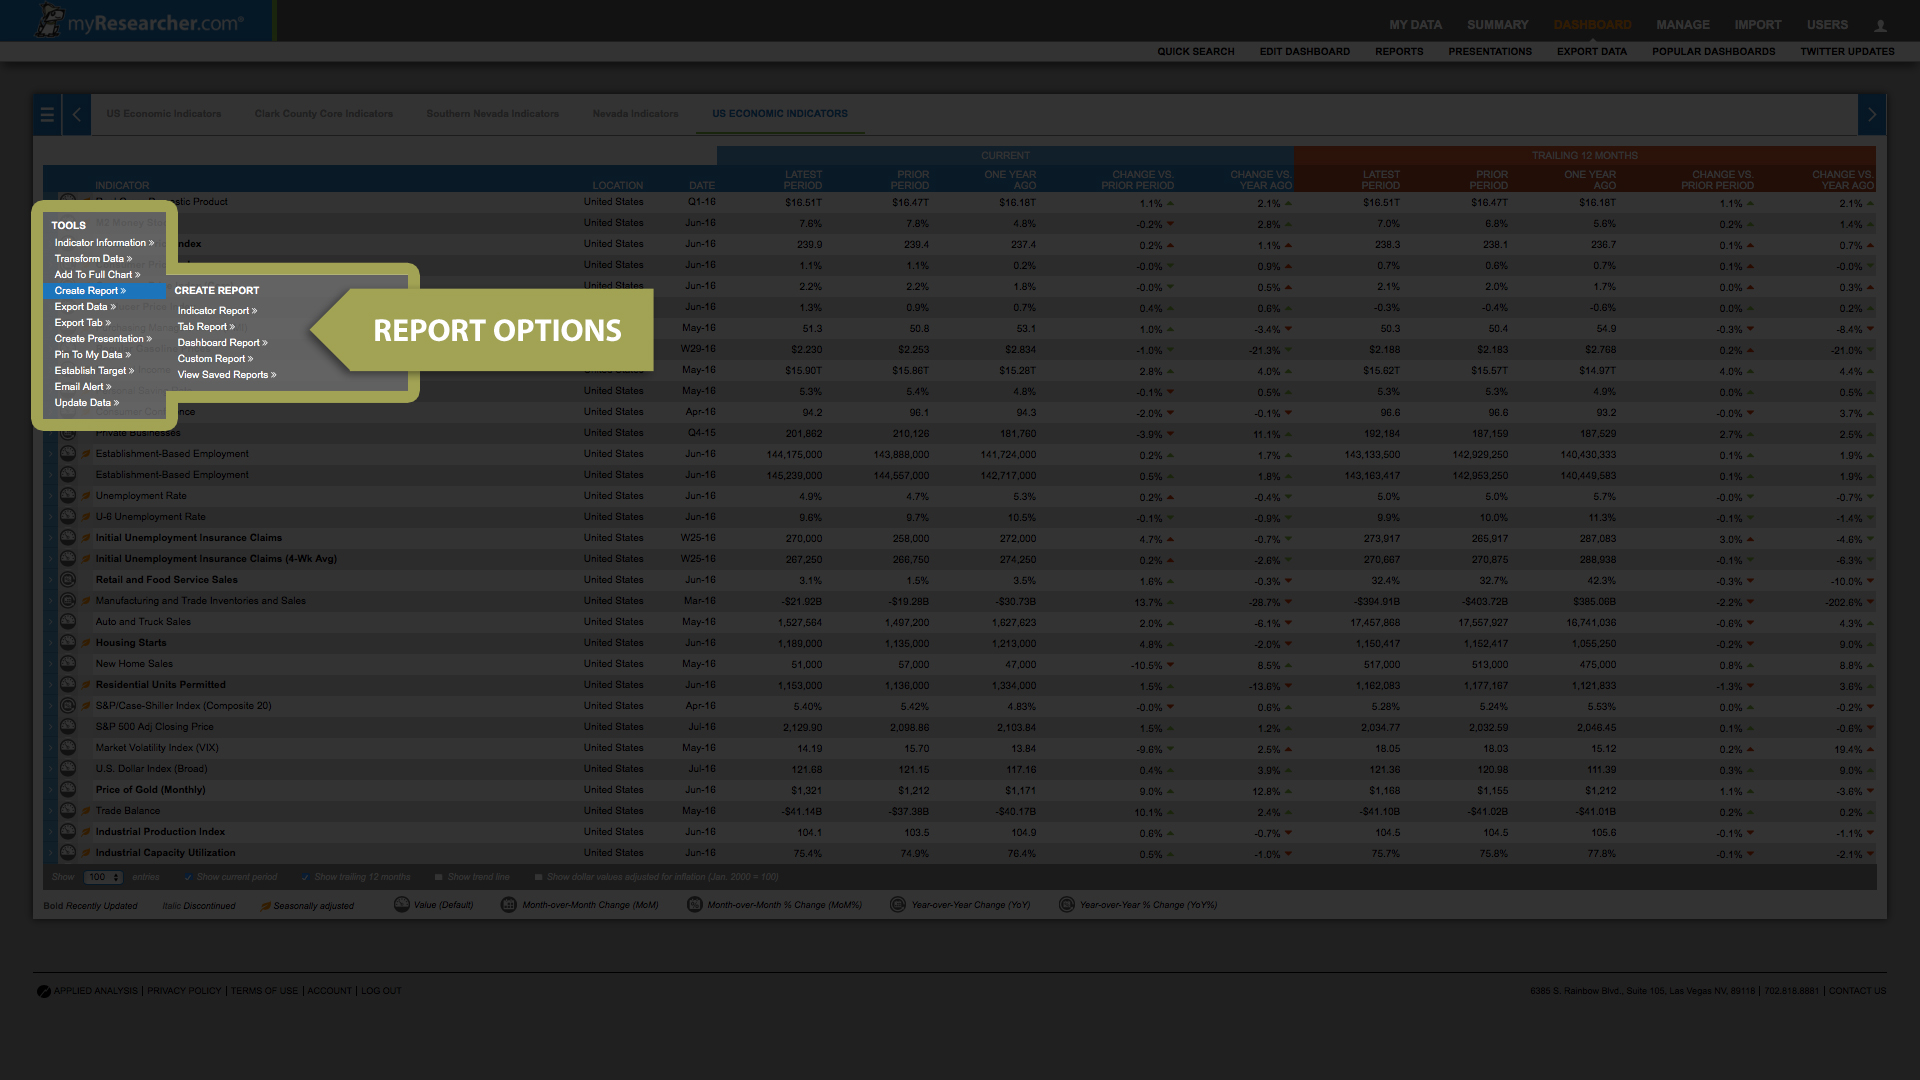
This will open up the Create Reports option menu. From here you can select to print reports for a single indicator, all the indicators on the active tab, or all the indicators on your Dashboard. You also have the option of creating a custom report.
MyResearcher offers multiple report formats. Two of the most popular “tab” report formats are shown below.
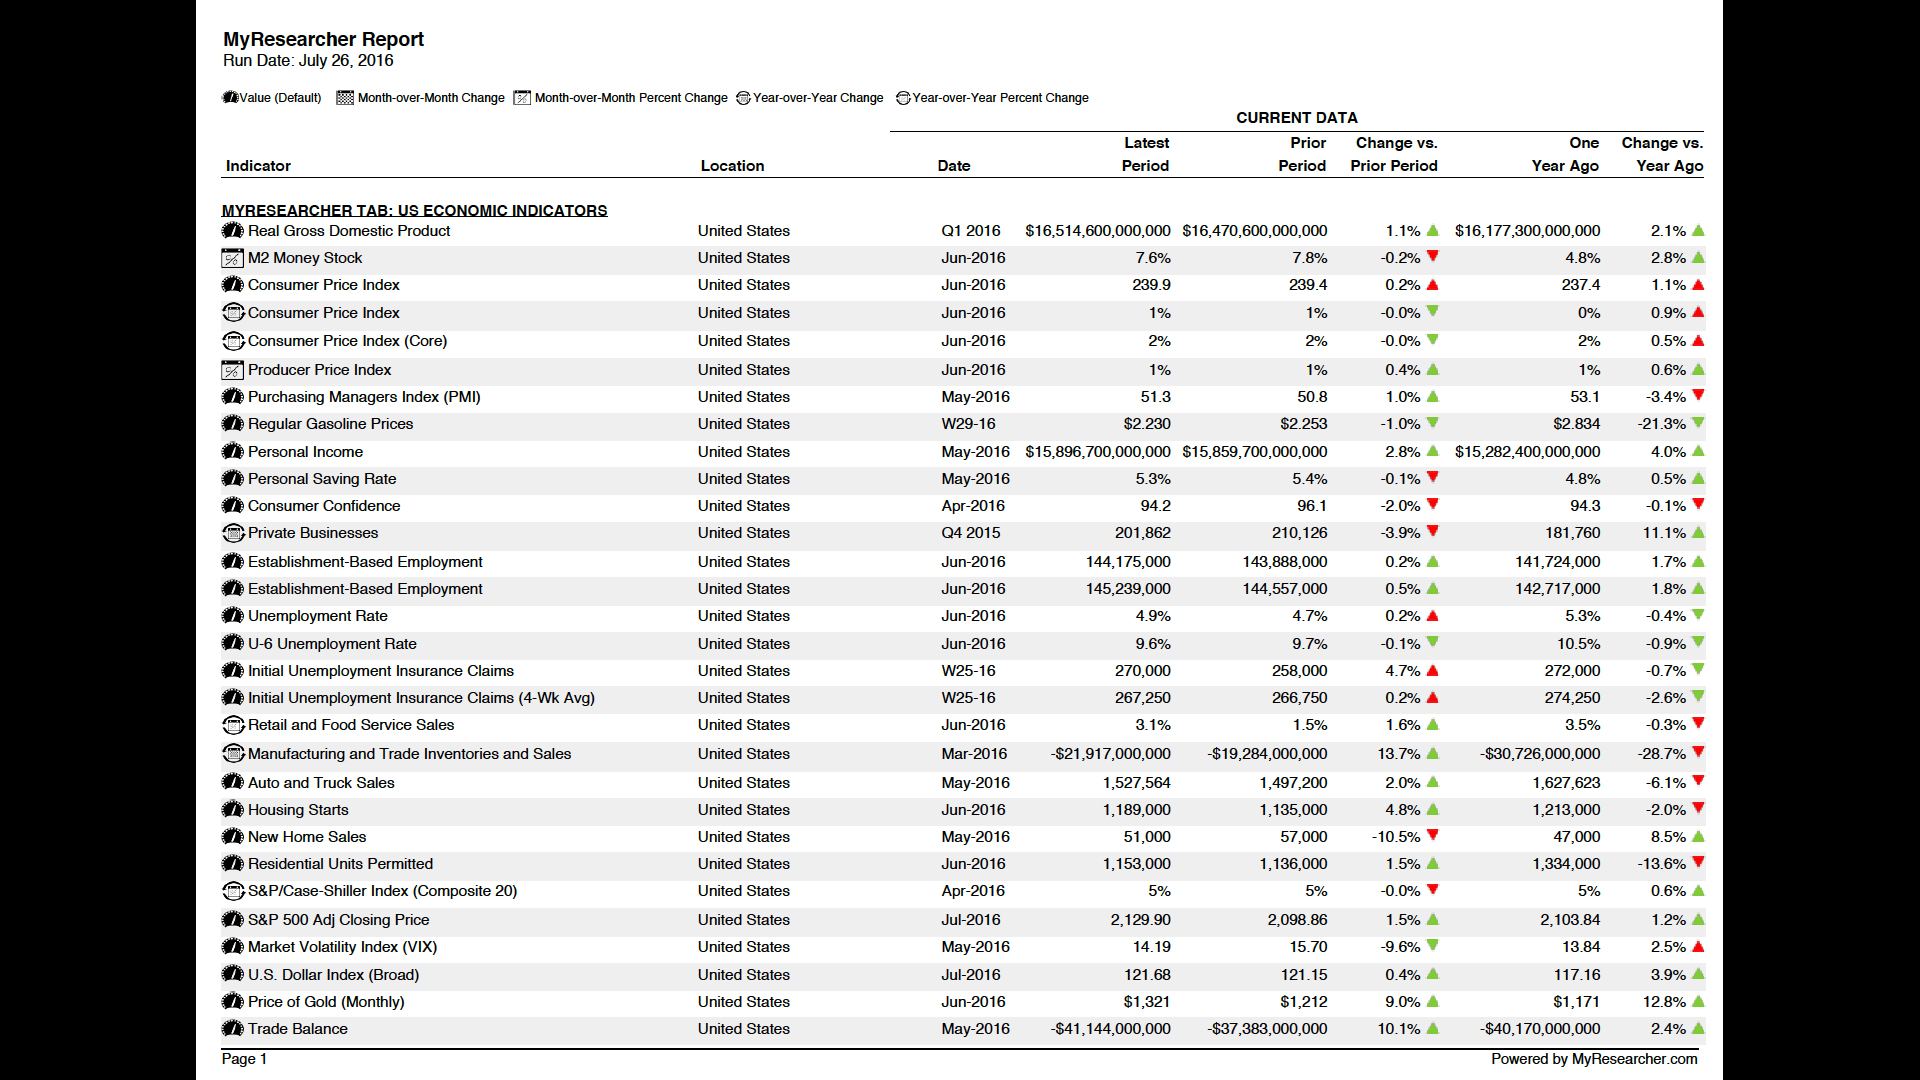
Tab Report | Current Data
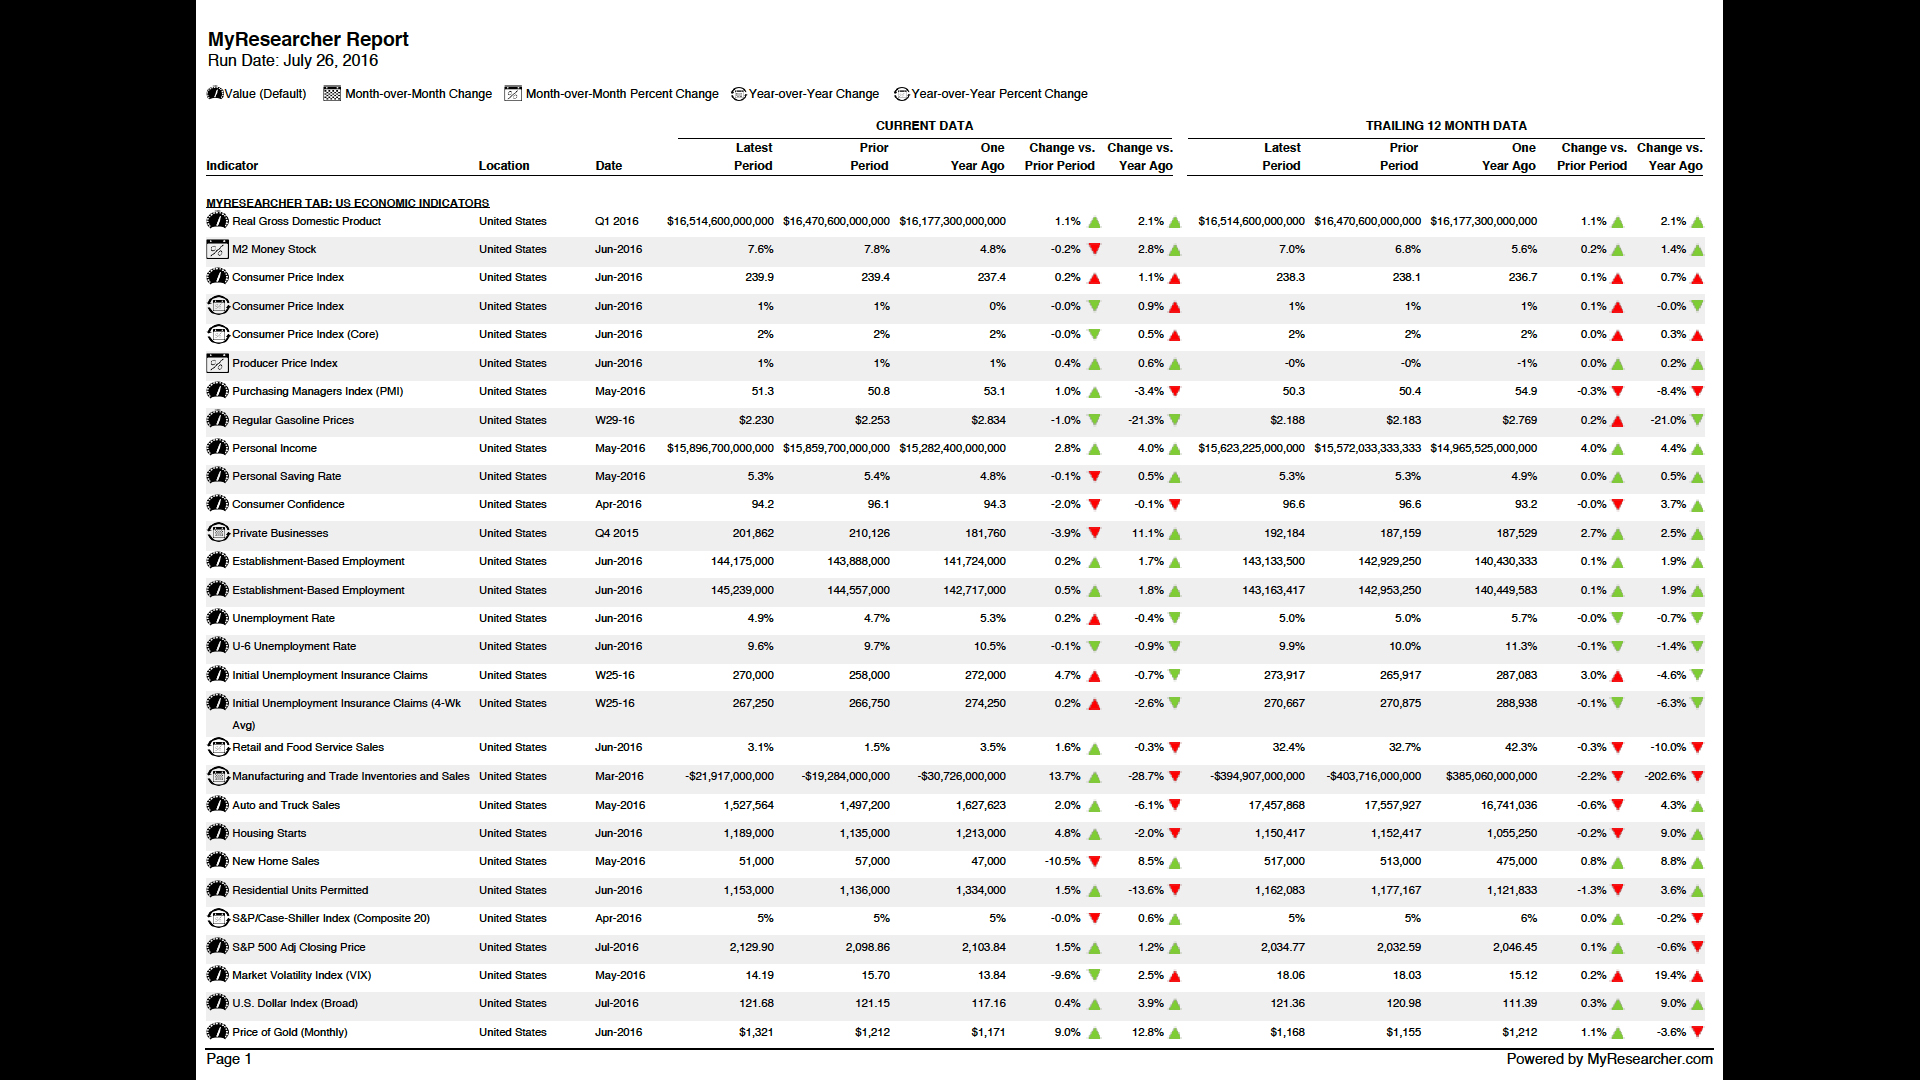
Tab Report | Current Data + Trailing 12 Months
From the “Dashboard” menu at the top of the page, click on the “Edit Dashboard” button in the submenu. This will open the Dashboard Editor.
From the Dashboard Editor, click the arrows on the left side of the indicator you wish to move, and drag it wherever you want it to appear on your dashboard.
Click the “Apply All Updates" Button to save the changes.
From the “Dashboard” menu at the top of the page, click on the “Edit Dashboard” button in the submenu. This will open the Dashboard Editor.
From the Dashboard Editor, click the arrows on the right side of the tab you wish to move, and drag it wherever you want it to appear on your dashboard.
Click the “Apply All Updates" Button to save the changes.
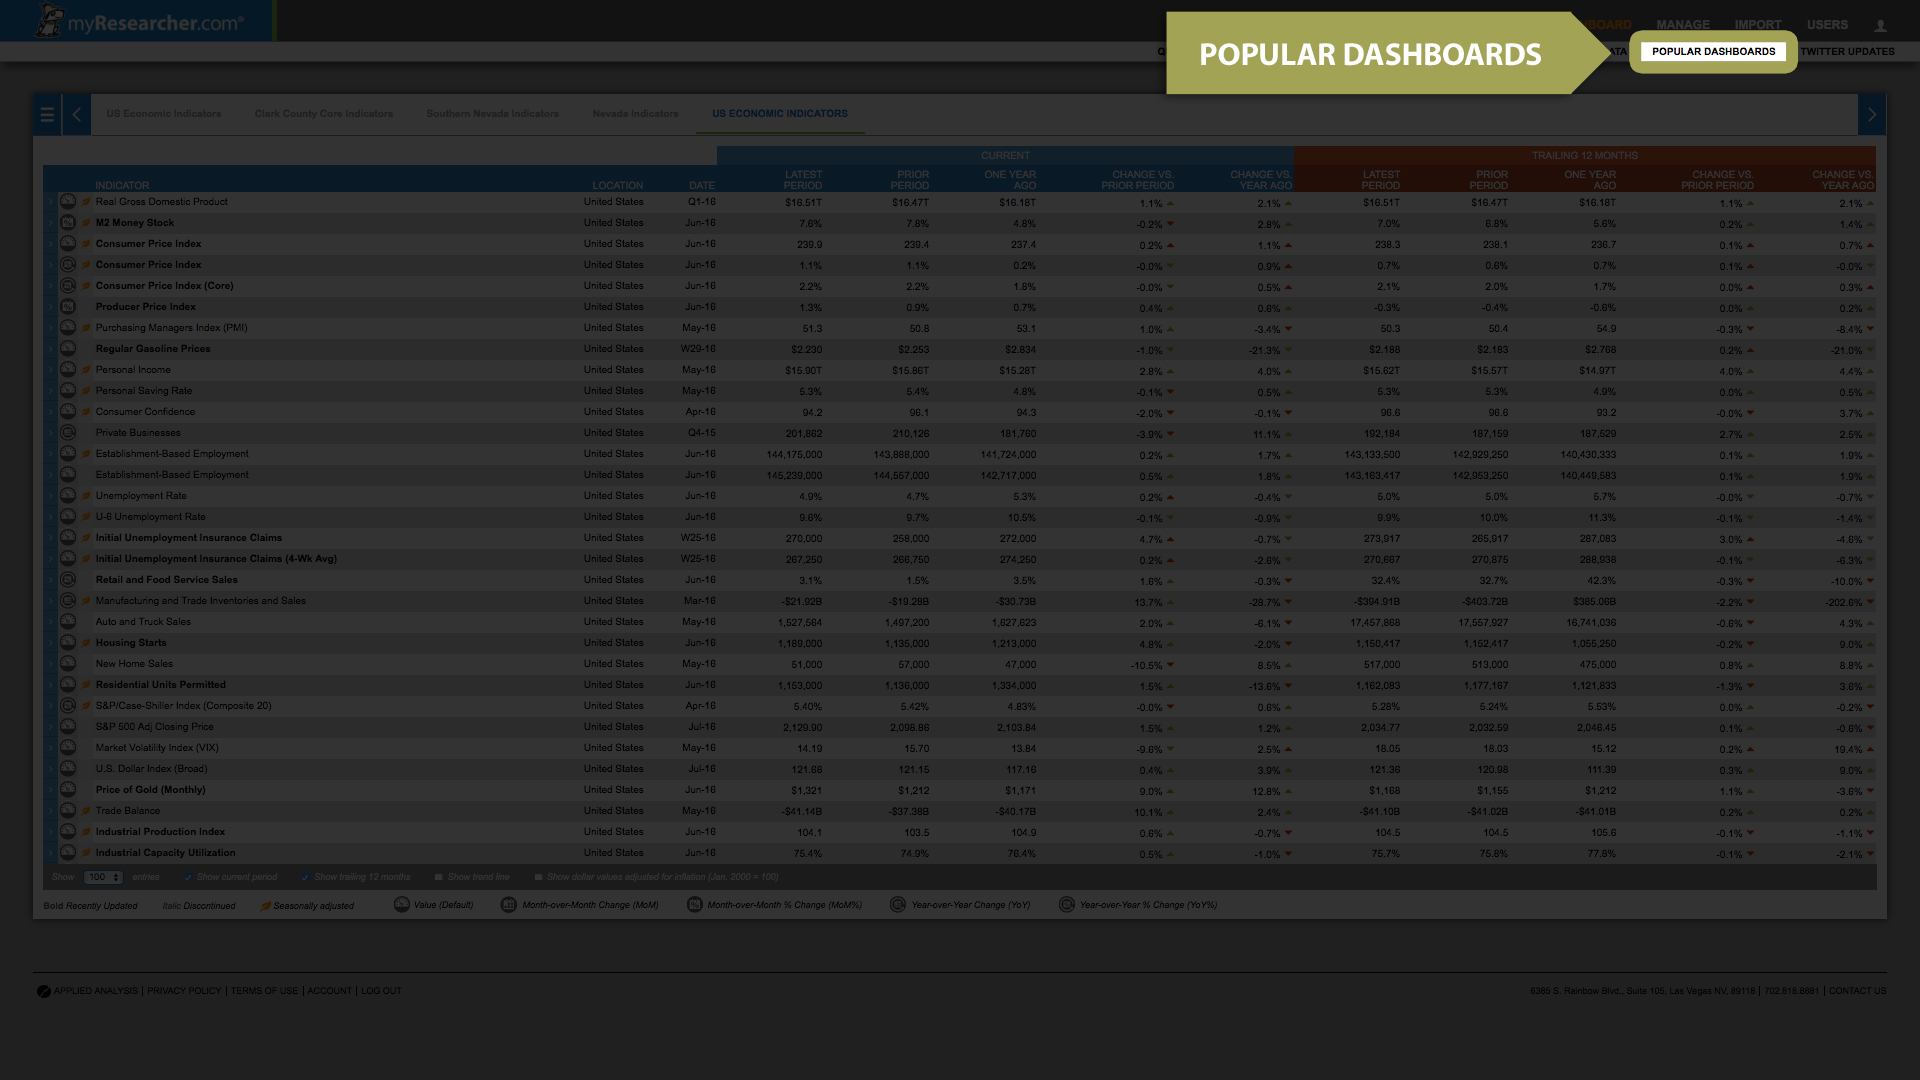
To access available popular dashboards, select the “Popular Dashboards” button from the submenu under the “Dashboard” button.
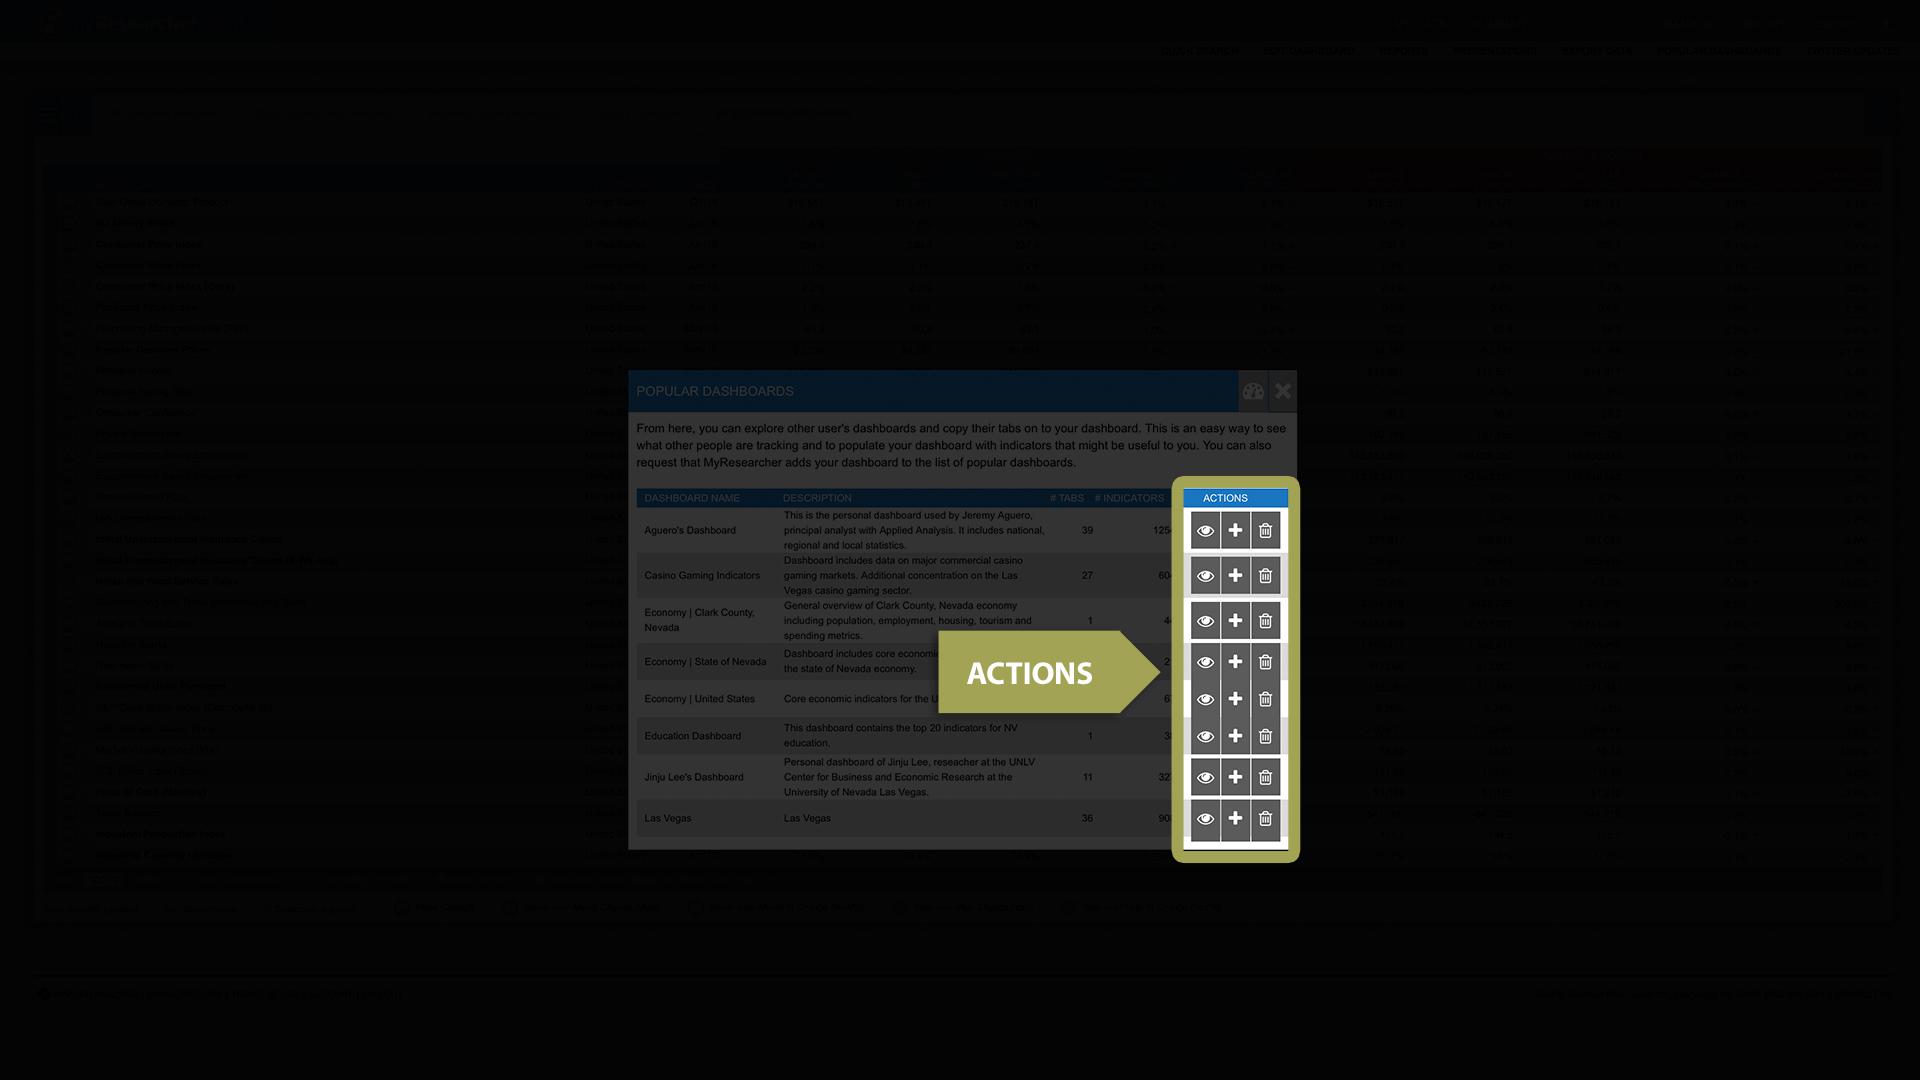
Users then have the option to view a popular dashboard, import selected tabs from a popular dashboard to their own dashboard, or to remove a selected user from popular dashboards.
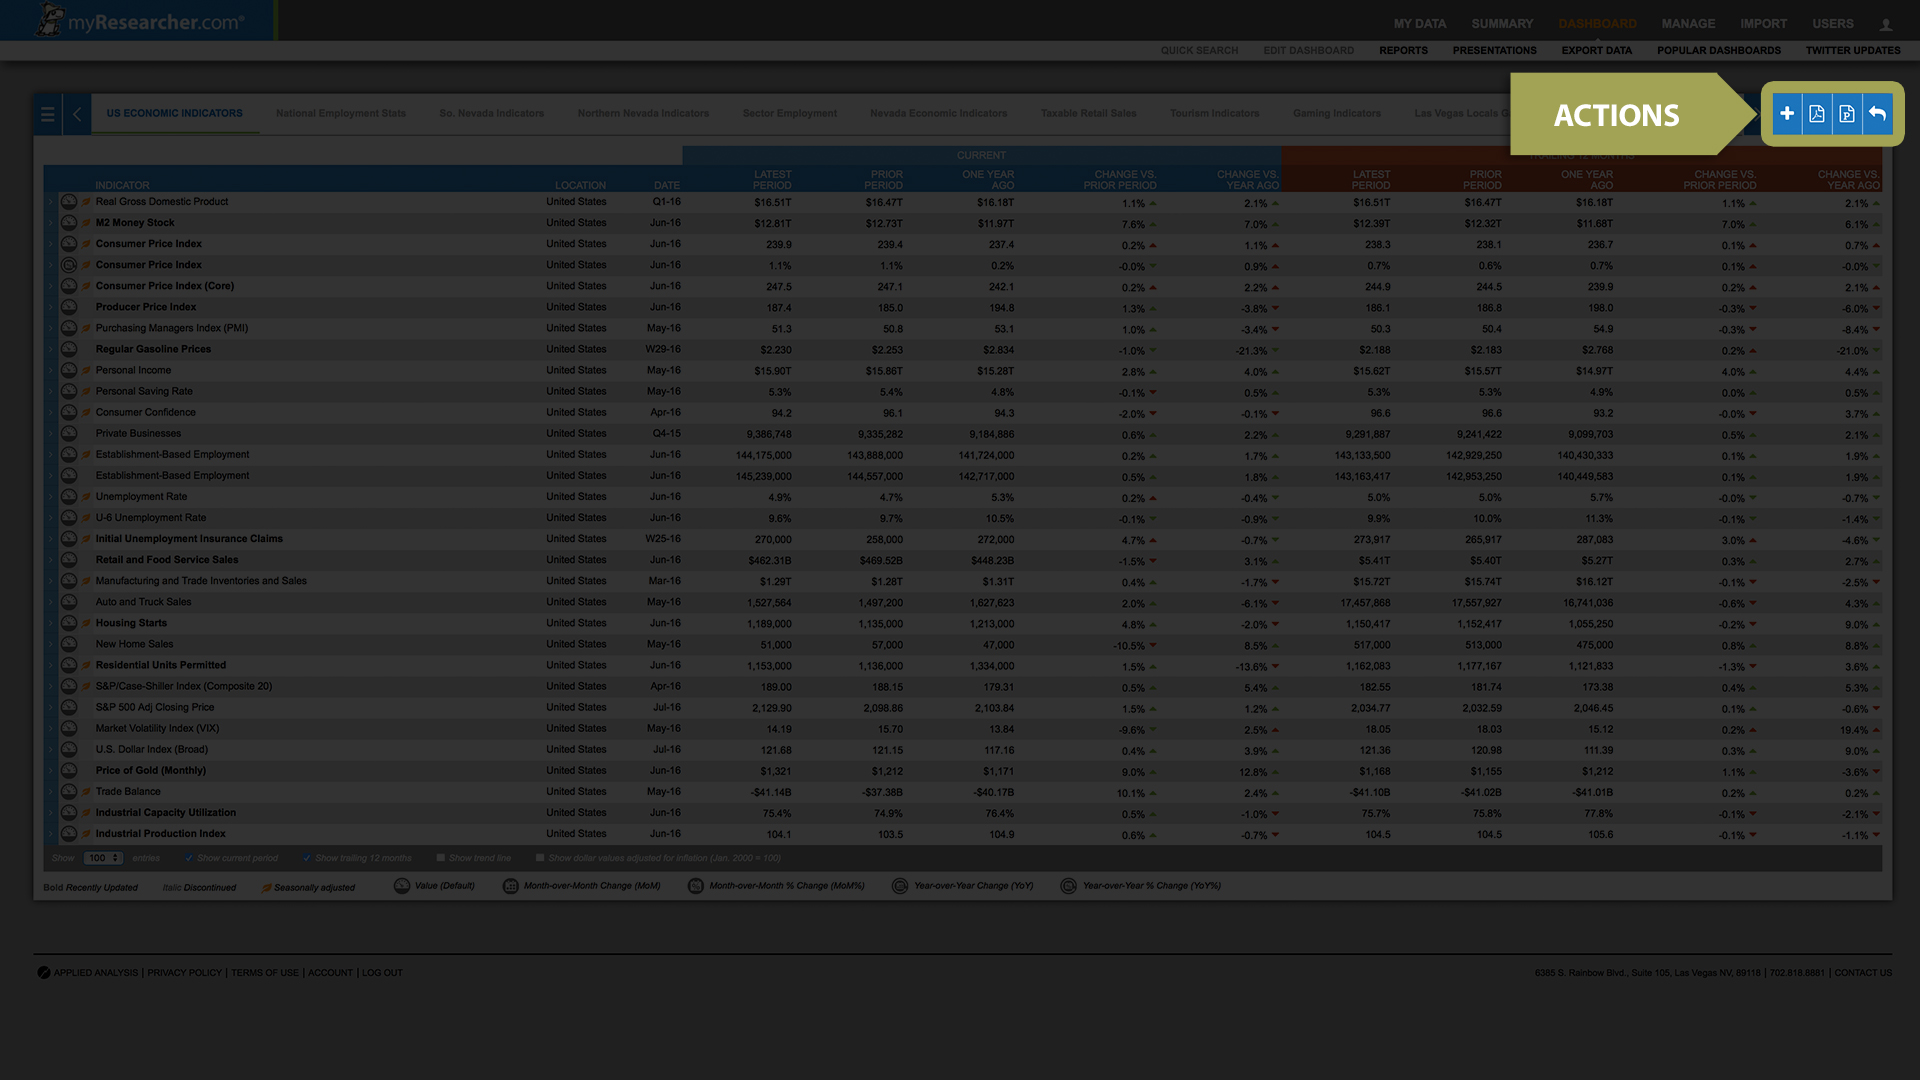
When viewing a popular dashboard, users have the option to add tabs from that dashboard to their own dashboard, create a report of the selected tab, create a presentation of the selected tab, or return back to their own dashboard.
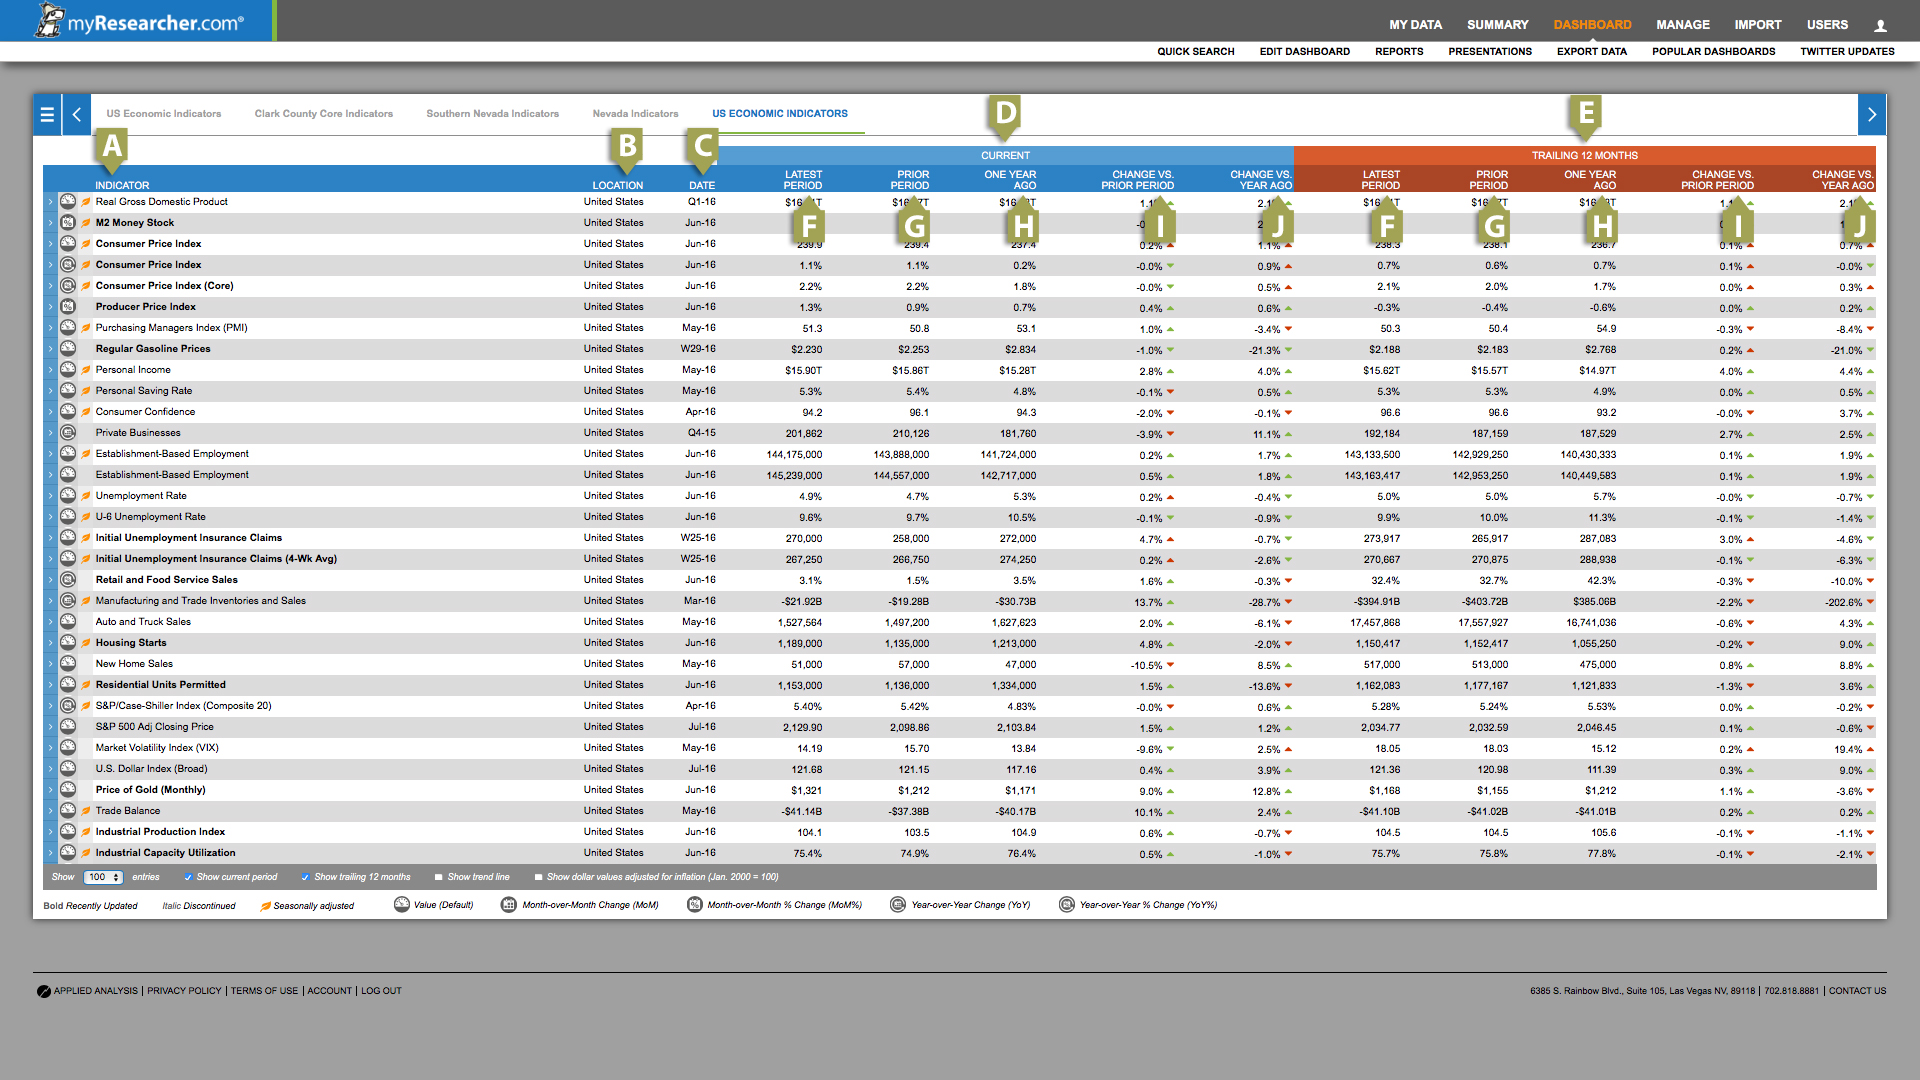
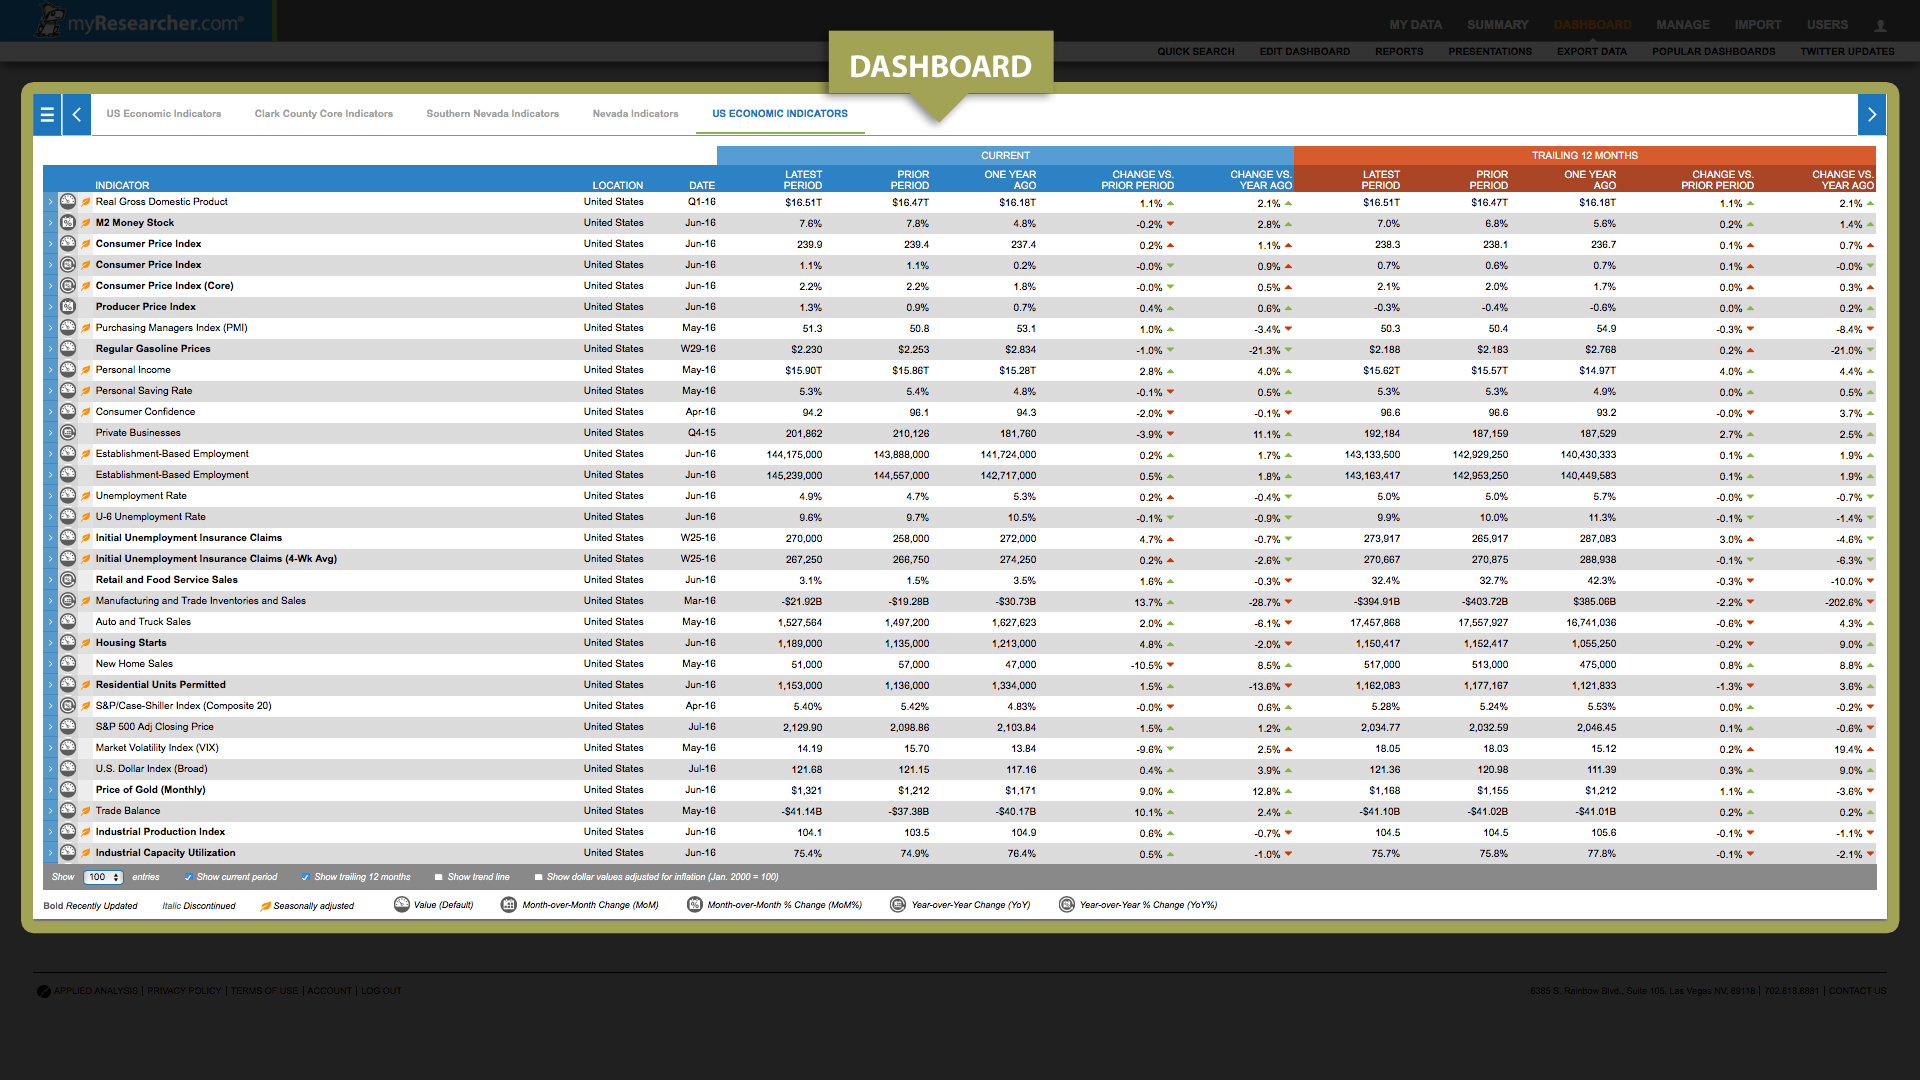
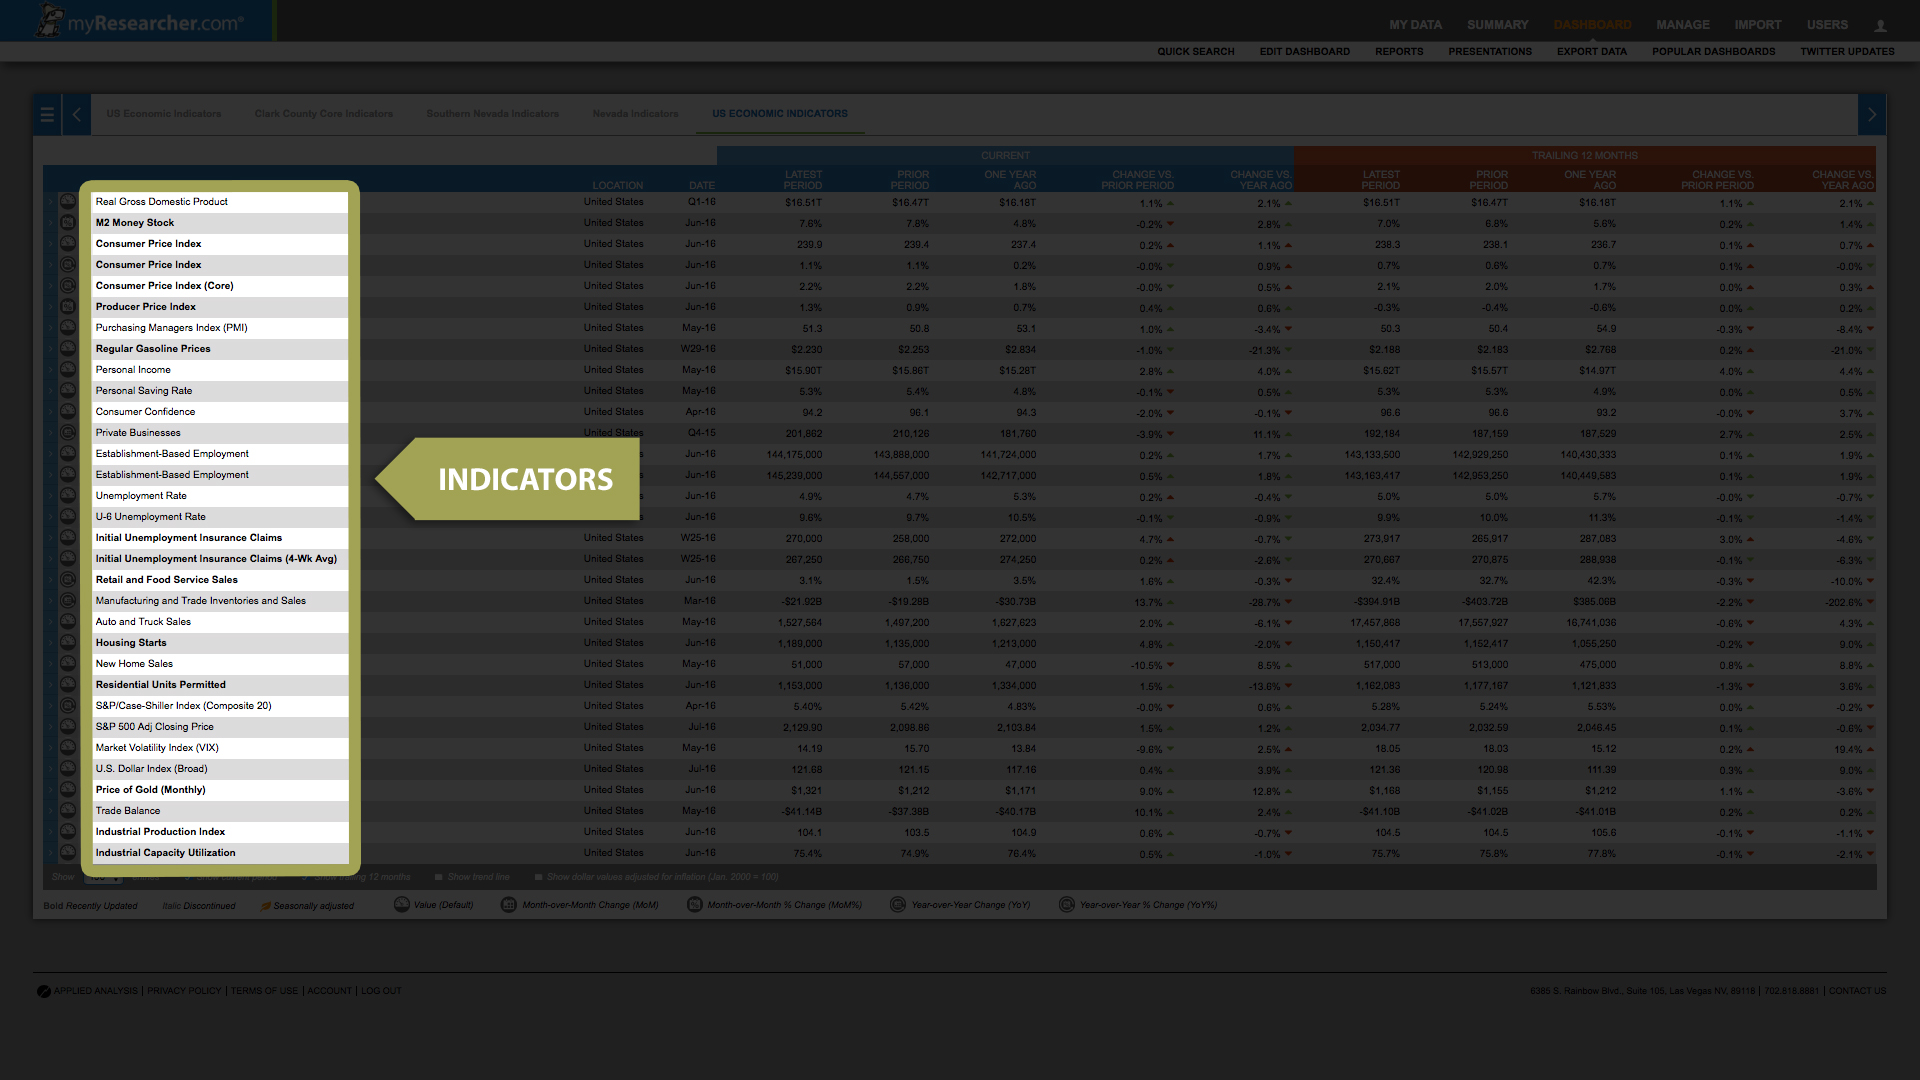
- A. Indicator – Indicators are the general term used to describe the data points that users track within their dashboards. Unemployment, for example, would be an indicator where the unemployment rate of 6.5% reported in August 2005 would be a data point within that indicator.
- B. Location – The location provides the geographic area the indicator reflects. The location can be as broad as national data (e.g., the United States or Norway) all the way down local submarket data (e.g., the Southwest Submarket or the North End).
- C. Date – The “Date” column reflects the latest release for the indicator. For example, a date of Apr-13 would denote that the most recent data available for that particular indicator are as of the month of April 2013. Users should keep in mind that this date is different from the date when the indicator was updated and uploaded to MyResearcher as there is commonly a lag period between when measured factors occur and when they are reported.
- D. Current – There are two sets of data routinely tracked on a MyResearcher Dashboard, these sets are referred to as “Current” data and “Trailing 12 Months” data. Current data reflect the data released for the current month, the current quarter, or the current year. If the latest release date is April 2013, for example, the “Current” data set will reflect the data released in April of that year or data related to the April 2013 release. Related data would include information for the prior month and the same month of the prior year for comparison purposes.
- E. Trailing 12 Months - There are two sets of data routinely tracked on a MyResearcher Dashboard, these sets are referred to as “Current” data and “Trailing 12 Months” data. Trailing 12 Months data reflect an average or sum of the data reported during the preceding 12-month period. If the latest release date is April 2013, for example, the “Trailing 12 Months” data set will reflect the data released from May 2012 through April 2013. These data are helpful because they smooth out the variation that can happened month to month or quarter to quarter due to seasonality and other factors.
When reviewing Trailing 12 Months data it is important to keep the aggregation form in mind. Some data, like the unemployment rates, are aggregated using averages, as it would be illogical to sum these data. Other data, like employment growth, is meaningful in an additive form. Finally, there are other data points that are reported monthly or quarterly as annualized values or at annualized rates. These data points will be the same in both the “Current” data set and the “Trailing 12 Months” data set. - F. Latest Period – The “Latest Period” reflects the most recent data available. These are the data as of the period reported under the “Date” column. If, for example, the indicator has a date of April 2013 the “Latest Period” value would reflect the unemployment rate, housing prices, retail sales or auto purchases, or other indicator value as of April 2013.
Importantly, under the “Current” column on the dashboard, these data will be for a single day, single month, single week or single quarter. By contrast, under the “Trailing 12 Months” column, the “Latest Period” data set reflects all of the data points for the 365-day period ending as of the date of the release. Using the example above, the “Latest Period” under the “Trailing 12 Months” column would reflect the 12 months ending April 2013. - G. Prior Period – The “Prior Period” reflects the period immediately preceding the “Latest Period”. For monthly data this would be prior month, for quarterly data the prior quarter and so on. If, for example, the “Latest Period” data are as of April 2013, the “Prior Period” data are as of March 2013.
Importantly, under the “Current” column on the dashboard, these data will be for a single day, single month, single week or single quarter. By contrast, under the “Trailing 12 Months” column, the “Prior Period” data set reflects all of the data points for the 365-day period ending as of the period prior to the date of the release. Using the example above, the “Prior Period” under the “Trailing 12 Months” column would reflect the 12 months ending March 2013. - H. One Year Ago – “One Year Ago” reflects the period 365 days prior to the “Latest Period”. For monthly data this would be same month of the prior year, for quarterly data the same quarter of the prior year and so on. If for example, the “Latest Period” data are as of April 2013, the “One Year Ago” data are as of April 2012.
Importantly, under the “Current” column on the dashboard, these data will be for a single day, single month, single week or single quarter. By contrast, under the “Trailing 12 Months” column, the “One Year Prior” data set reflects all of the data points for the 365-day period ending as of the one year prior to the date of the release. Using the example above, the “One Year Prior” under the “Trailing 12 Months” column would reflect the 12 months ending April 2012. - I. Change vs. Prior Period – The “Change vs. Prior Period” column reflects the growth rate between the “Current Period” and the “Prior Period”. This is calculated as: (Current Period – Prior Period)/Prior Period. This provides week-over-week, month-over-month or quarter-over-quarter growth rates.
- J. Change vs. One Year Ago – The “Change vs. One Year Ago” column reflects the growth rate between the “Current Period” and the indicator values report “One Year Ago”. This is calculated as: (Current Period – One Year Ago)/One Year Ago. This provides year-over-year growth rates.